Gold Slides Toward $4,320 as Hot US PPI Fuels Fed Rate-Hike Bets
Overview
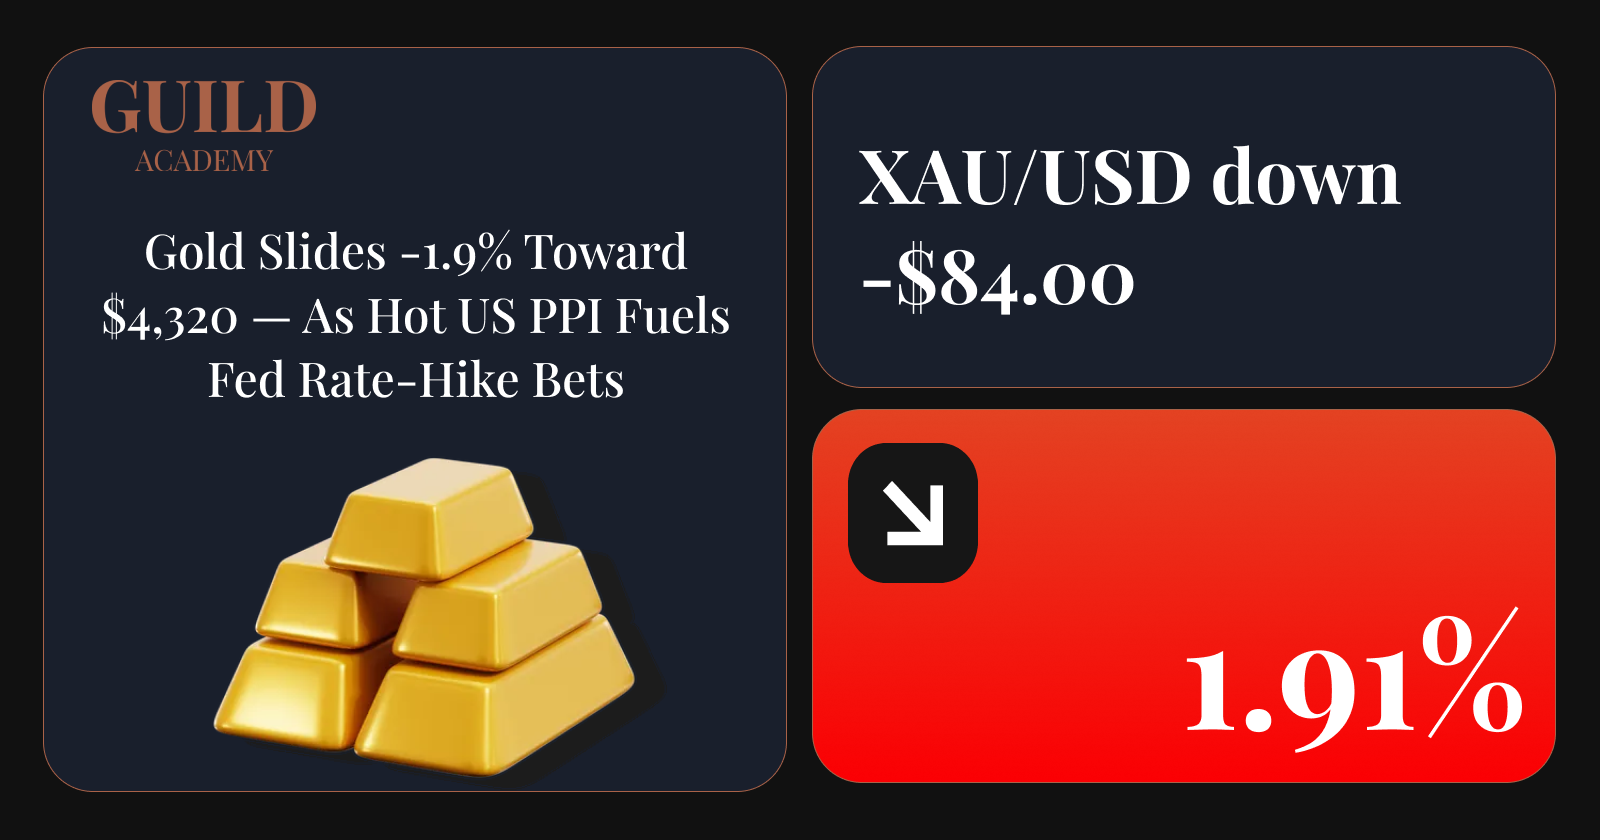
Gold came under heavy selling pressure, falling more than 1% from above $4,400 toward $4,320 as stronger US inflation pressures drove Treasury yields and the US dollar higher.
August US producer inflation reinforced expectations for tighter Federal Reserve policy, with headline PPI rising 0.4% m/m and accelerating to 5.4% y/y, slightly above the 5.3% forecast. Markets raised the probability of a 25bp Fed rate hike next week to around 70%.
XAU/USD's technical picture has turned increasingly bearish, with price testing the major $4,330 support area, riding the lower Bollinger Band and breaking below the 100 and 200 EMAs. A sustained breakdown could expose $4,175 as the next major support.
What's Driving The Gold Price Down Today?
Hot US producer inflation pressured gold: August headline PPI increased 0.4% m/m, matching expectations, while annual inflation accelerated to 5.4%, exceeding the 5.3% forecast and reinforcing concerns that US inflation remains elevated.
Federal Reserve rate-hike expectations strengthened: Persistent producer inflation, alongside oil prices above $100, pushed market expectations for a 25bp Fed rate hike next week to approximately 70%, creating a more challenging monetary-policy environment for gold.
US Treasury yields climbed: The US 10-year Treasury yield moved toward 4.93% following the inflation data. Rising yields increase the opportunity cost of holding non-yielding assets such as gold, contributing to Thursday's selling pressure.
A stronger US dollar added another headwind: The dollar strengthened as traders increased expectations for additional Fed tightening, making dollar-denominated gold more expensive for holders of other currencies and intensifying pressure on XAU/USD.
Attention now shifts toward US CPI: Today's US CPI report represents the next major test for gold. Further evidence of persistent inflation could strengthen September Fed rate-hike expectations and maintain pressure on the metal through higher yields and a stronger dollar.
Technical Analysis of XAU/USD
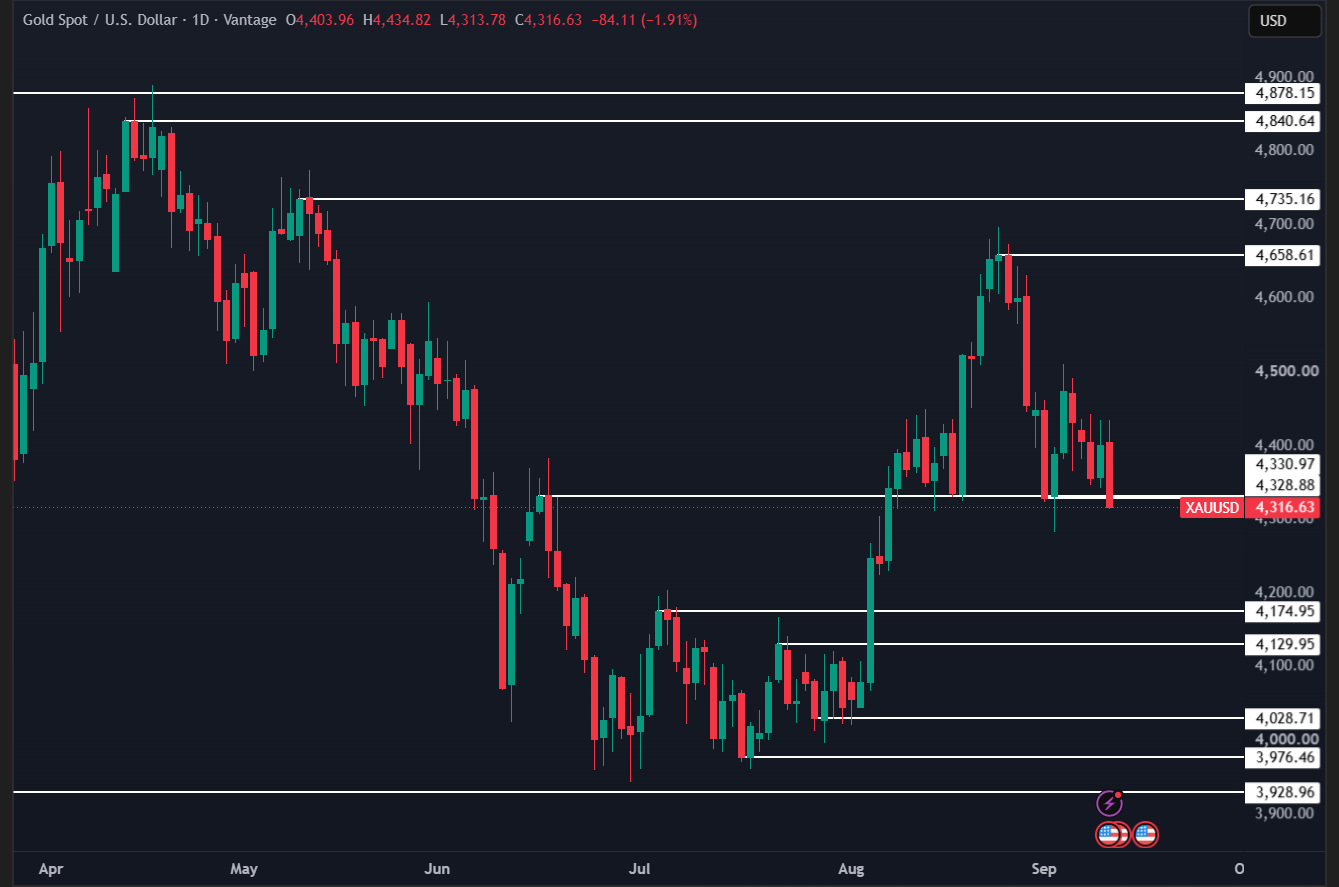
XAU/USD has developed a bearish short-term bias, falling from an intraday peak around $4,430 toward $4,316 and forming sustained lower highs and lower lows. Showing price closing beneath the key $4,330 area after a failed intraday recovery.
RSI (14) at 45 signals increasing selling pressure, while price riding the lower Bollinger Band reinforces the bearish move. Widening Bollinger Bands indicate elevated volatility and suggest the market is experiencing a strong directional move.
MACD provides a mixed but weakening momentum signal: the MACD line remains above the signal line, preserving the existing bullish crossover, but the shrinking histogram indicates that bullish momentum is fading as sellers gain control.
The EMA structure is deteriorating: price is testing the 20 and 50 EMAs as medium-term resistance while breaking below the 100 and 200 EMAs. This signals weakening longer-term bullish momentum and raises the possibility of a broader bearish trend developing.
$4,330 is the critical support area: a sustained break below this level could expose $4,175 as the next major downside target. Alternatively, a recovery would first need to overcome the EMA resistance zone before the technical focus can shift back toward major resistance at $4,660, followed by $4,735.