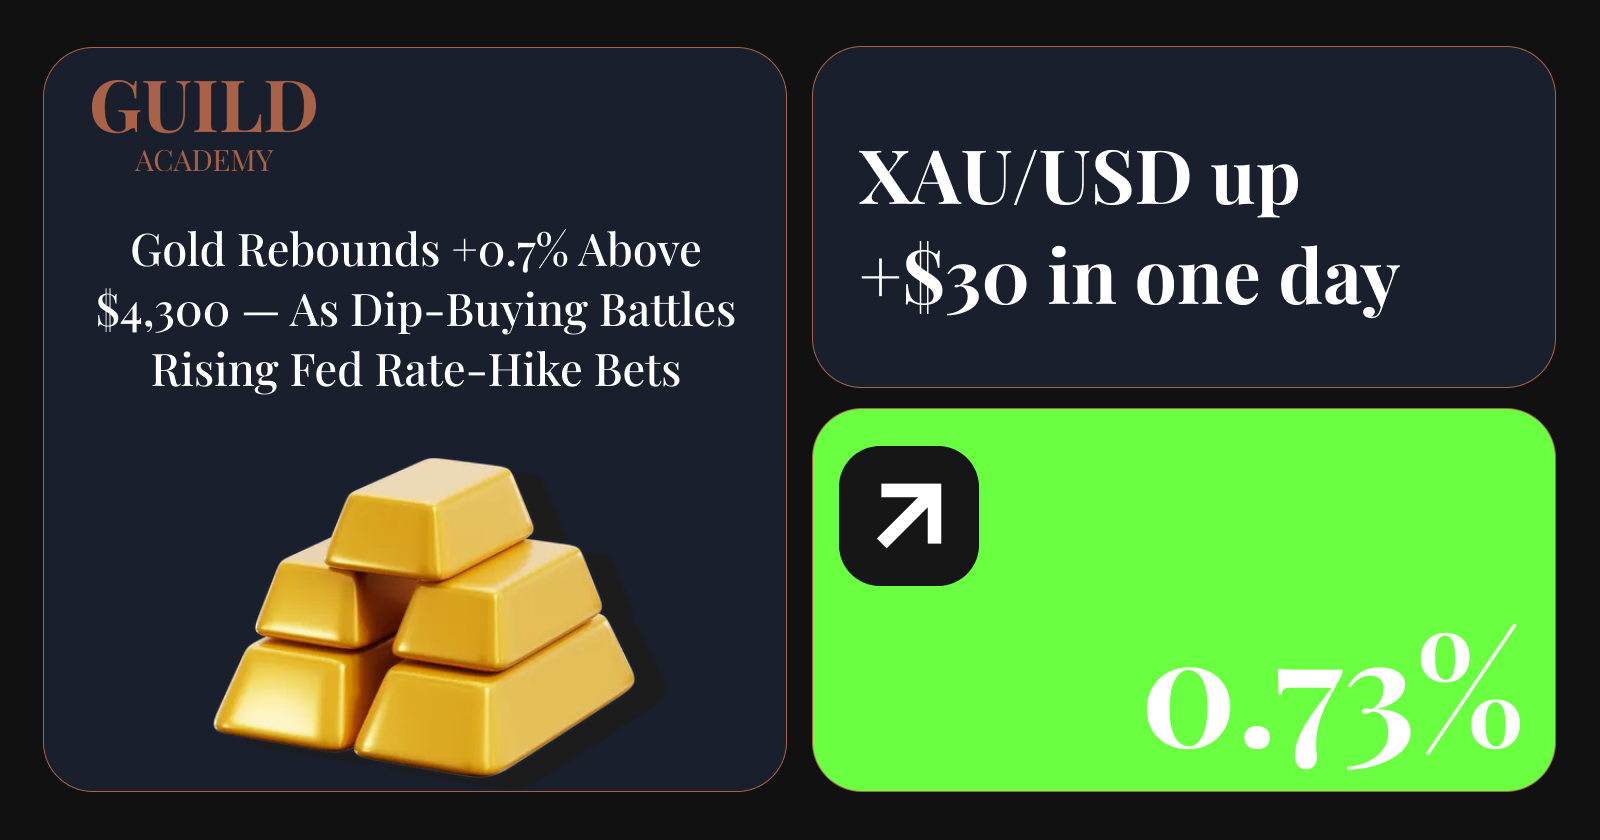
🥇 Gold Rebounds Above $4,300 as Dip-Buying Battles Rising Fed Rate-Hike Bets
📋 Overview
Gold staged a sharp rebound following the US CPI release, recovering from below $4,300 to above $4,400 before settling near $4,348 as dip-buying, fading US dollar gains and easing Treasury yields supported XAU/USD.
US inflation strengthened expectations for another Federal Reserve rate hike, with headline CPI rising 0.4% m/m and 3.4% y/y, while monthly core CPI exceeded forecasts at 0.3%. Markets subsequently raised the probability of a 25bps September rate hike to roughly 86%–91%.
The technical picture remains vulnerable despite the rebound, with RSI below 50, price pressured near the lower Bollinger Band and the 200 EMA beginning to break. The $4,330 support region remains critical for determining gold's next directional move.
🔎 What Drove The Gold Price Up?
Dip-buying drove gold's recovery: XAU/USD initially dropped below $4,300 following the US CPI release before buyers entered aggressively, driving the metal above $4,400 during Friday's rebound and leaving spot gold more than 1% higher during the session.
The US dollar's initial CPI-driven advance faded: Gold initially weakened as the dollar strengthened following the inflation figures, but the reversal in dollar gains helped bullion recover and supported renewed demand at lower prices.
Easing Treasury yields provided additional support: Treasury yields retreated after their initial reaction to the inflation report, reducing some of the pressure on non-yielding gold and helping XAU/USD recover from its post-CPI lows.
Firm inflation remains a major headwind: Headline CPI increased 0.4% m/m and 3.4% y/y, while core CPI rose 0.3% m/m against a 0.2% forecast. The figures lifted the probability of a 25bps September Fed rate hike to approximately 86%–91%, limiting conviction behind gold's rebound.
Next week's Federal Reserve decision is now critical: Gold is finding short-term support despite increasingly hawkish rate expectations, leaving the upcoming Fed decision and Chair Kevin Warsh's guidance important for determining whether the rebound can extend or renewed selling pressure emerges.
📈 Technical Analysis of XAU/USD
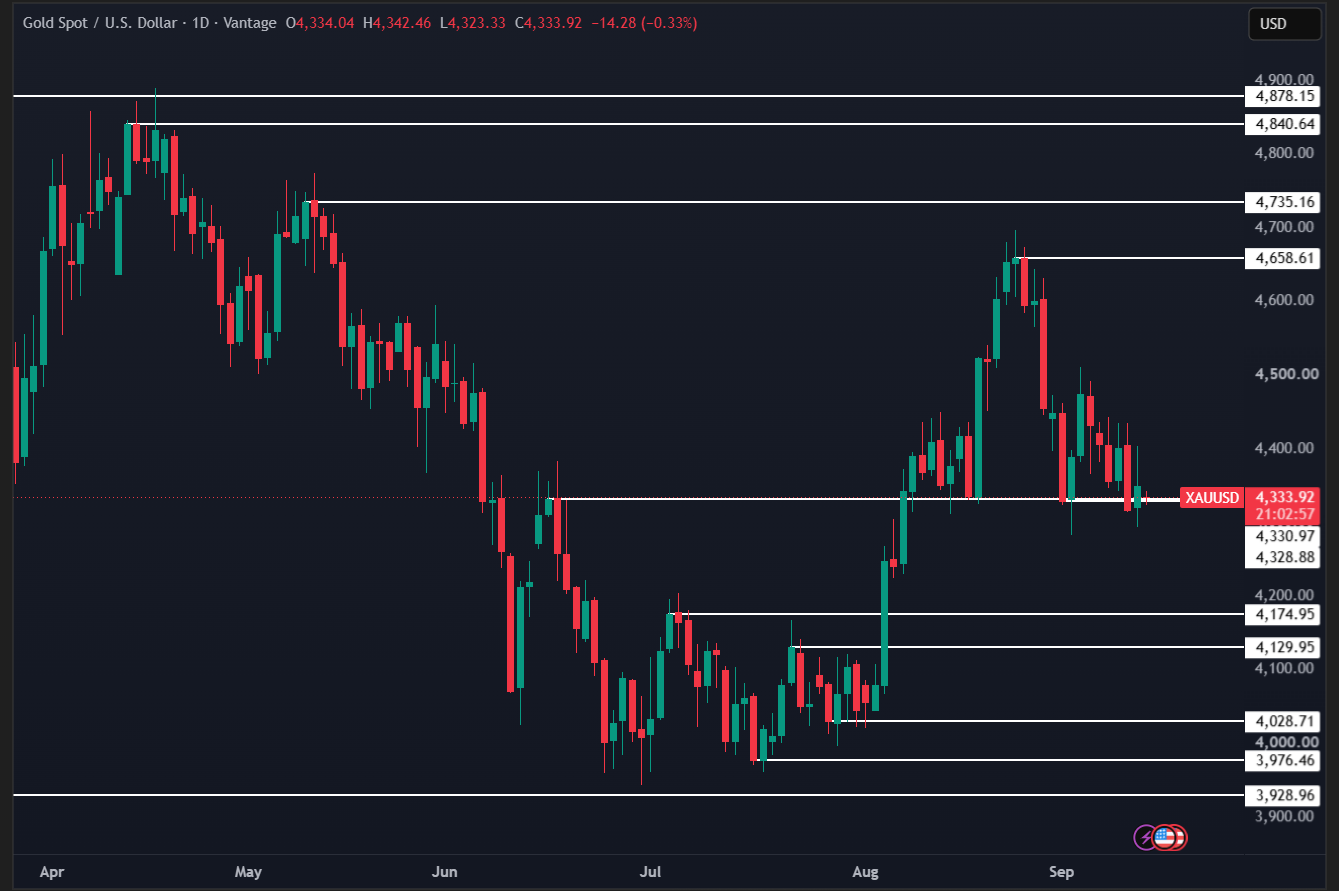
XAU/USD ended the week near $4,348, consolidating around the important $4,330 support region after retreating substantially from the late-August high near $4,660. The chart on page 3 shows price repeatedly testing this support zone during the recent pullback.
RSI (14) at 47 maintains a bearish near-term signal, indicating continued selling pressure with momentum remaining below the neutral 50 level. Price riding the lower Bollinger Band reinforces this bearish pressure, while widening bands point to elevated volatility.
MACD remains technically bullish but is losing strength: the MACD line remains above the signal line, maintaining its bullish crossover, but the shrinking histogram shows that the previous upward momentum is weakening.
Moving averages highlight a vulnerable broader structure: price is testing the 20, 50 and 100 EMAs, making these important medium-to-long-term resistance areas, while the developing break below the 200 EMA indicates weakening long-term bullish momentum and the possibility of a bearish trend developing.
$4,330 is the key downside level to watch: a sustained break below this support could expose $4,175 as the next major downside level. Conversely, a recovery would ultimately need to overcome the $4,660 resistance area to materially strengthen the broader bullish outlook.