Deep Dive: The Nasdaq Looks Cheap Because Earnings Haven't Moved Yet
The Nasdaq-100 trades at about 20.5 times the earnings analysts expect over the next twelve months. It last traded near that level around the end of 2022, when ChatGPT had just launched. Price has fallen, but the earnings side of the ratio has not yet moved, and the next two weeks of reports will decide where it goes.
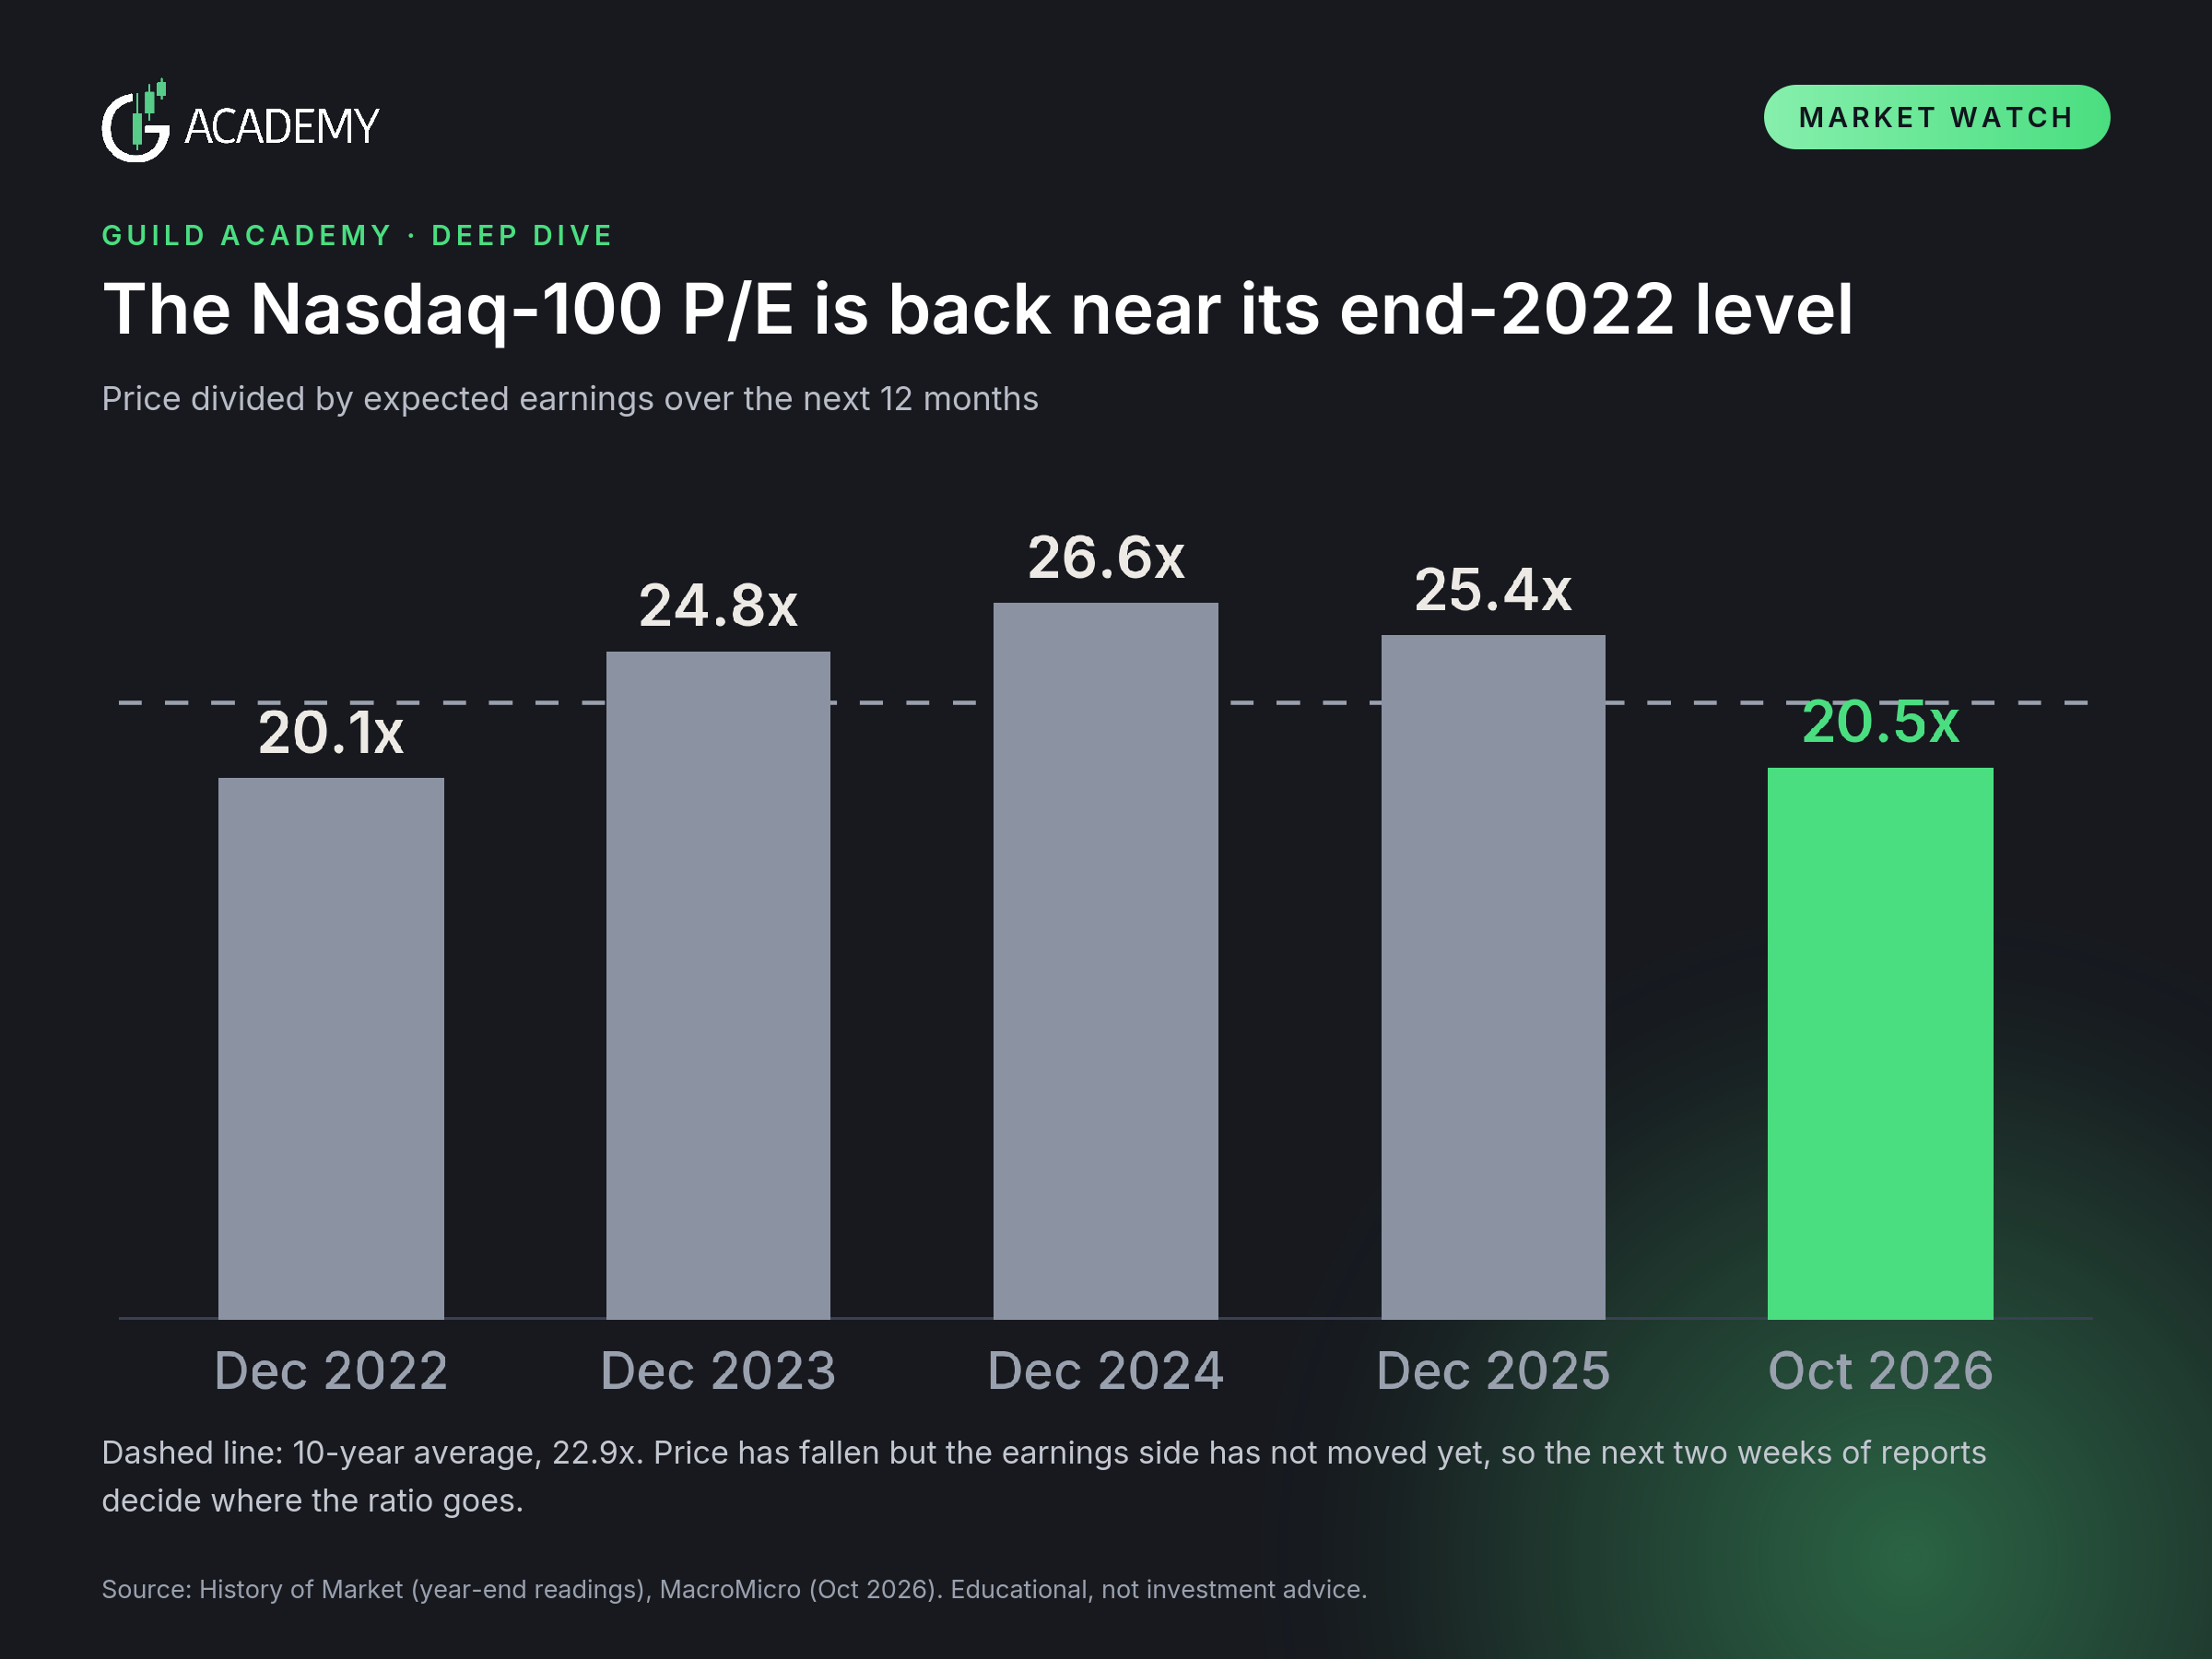
The number is a forward P/E, which uses analysts' estimates for the next twelve months. That is the right yardstick here, because trailing P/E sits far higher, between about 27 and 35 depending on the source. On the forward measure, the Nasdaq-100 is about 19% below its end-2025 reading of 25.4x and well under its 10-year average of 22.9x.
The reset has been sharp this year. Citadel Securities showed the index at 21.7x on September 30, already 14% below its 2026 high, and the multiple has slid further since. The S&P 500 trades at 19.0x forward earnings, 15% below its high, which is close to its 10-year average. Earnings growth is the other half of the story: one source puts Nasdaq-100 earnings up about 49% over the past year.
Price has moved, earnings have not
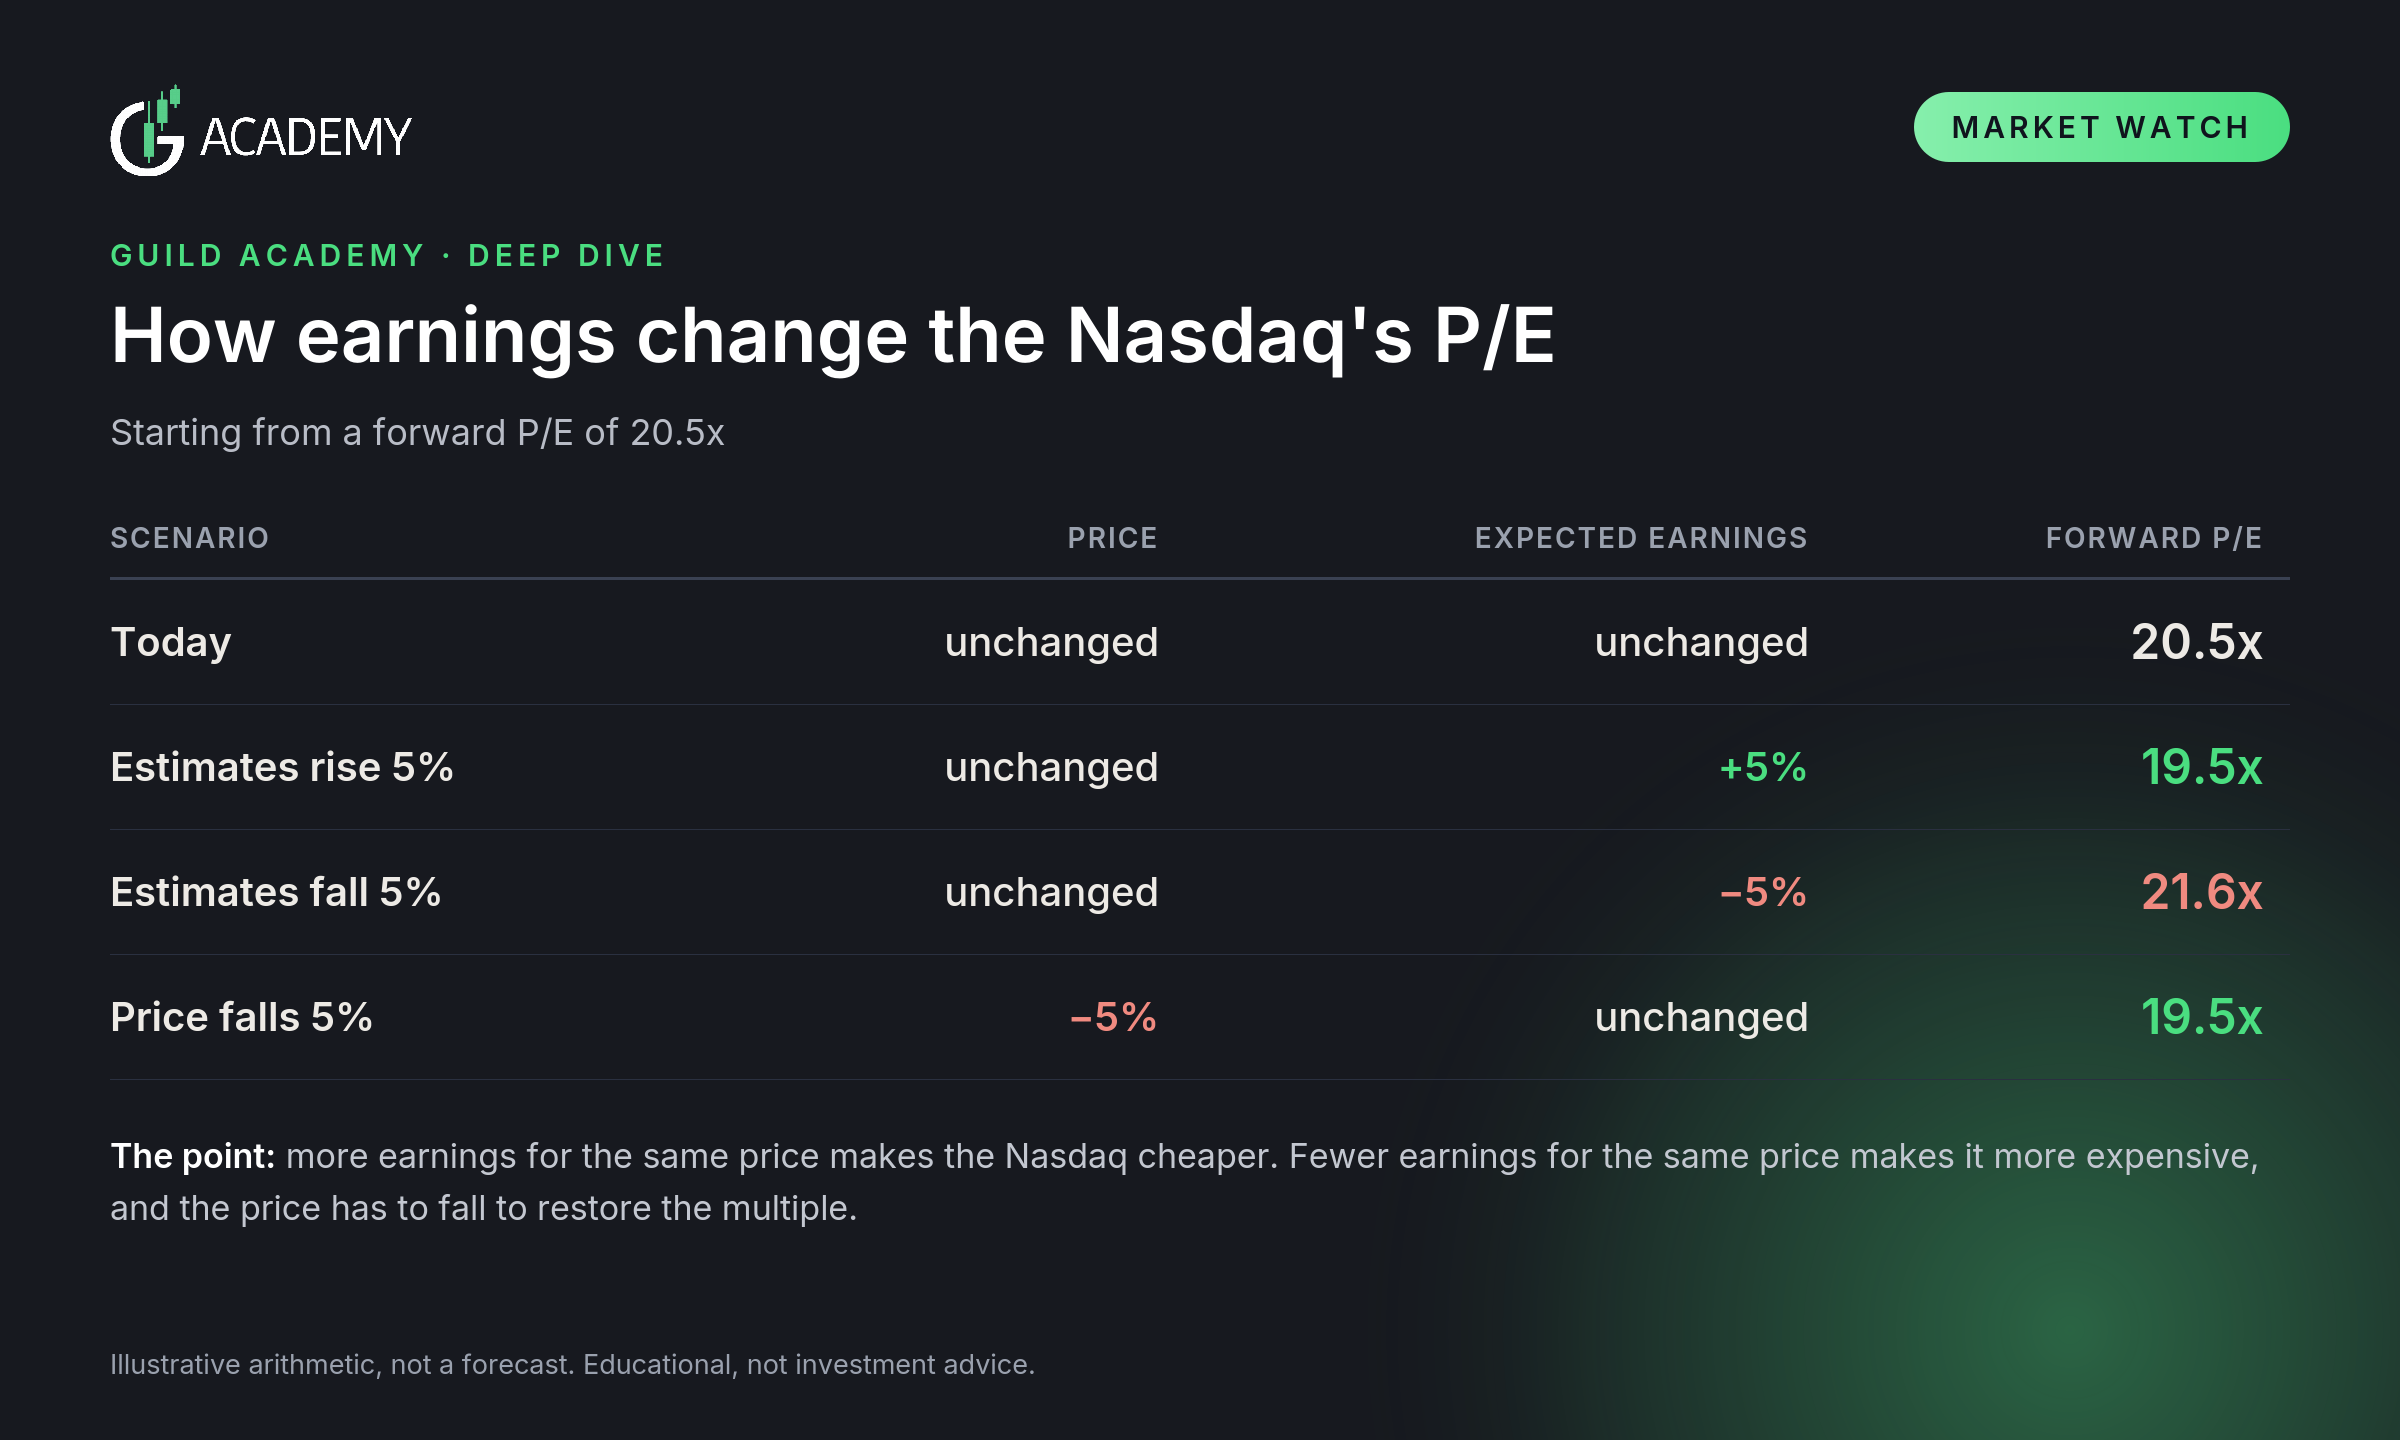
A P/E has two parts, and only one has changed so far. The price fell: the Nasdaq Composite had its worst week since June, down about 4.5%, and tech was the weakest sector in October. The earnings side still reflects analyst estimates from before the selloff, and those estimates have been rising, not falling. Citadel Securities notes the bar for earnings has moved higher this year. That is why the ratio dropped.
The next two weeks change that. Only about 9% of the S&P 500 has reported, and 76 of its companies report this week, the third-busiest week of the season. Every report and every guidance update shifts the estimates, and the estimates set the multiple. A simple example shows how:
Early in the season, investors have punished disappointments harder than they have rewarded beats, although trading on October 19 showed tentative signs that sentiment is stabilizing.
Two ways the next two weeks can go
The outcome depends on whether the numbers and the guidance move estimates up or down.
Stronger earnings. Estimates rise while prices hold or recover, so the P/E falls further and the Nasdaq looks even cheaper. Investors get more earnings for a price that has already come down, and the fear can fade as buyers scoop up cheap tech names.
Weaker earnings. Estimates fall, so the same price buys fewer earnings and the P/E rises. The Nasdaq then has to find a new, lower price to attract buyers, and the "great broadening out" trade continues, with money moving from the mega-cap tech leaders into other parts of the market.
That rotation is already visible. Last week staples, energy and health care led while the chip index fell 11.4%. Guidance often matters more than the quarter itself, because it sets next year's estimates.
The March precedent
March of this year set up the same way. In the first quarter the Nasdaq fell 7%, and Microsoft lost 23% of its value, its worst quarter since 2008. Its earnings multiple dropped to the lowest since the fourth quarter of 2022, even though its revenue growth had accTwo ways the next two weeks can goelerated to almost 17%. The price fell while the business kept growing, which is what a cheap multiple looks like. By late March the Nasdaq-100 had dropped to about 22,950.
Then it turned. From that low, one analysis shows the index climbing more than 33% in about ten weeks to records above 30,600. That is the setup the Microsoft plays in March were built on: a low multiple, earnings still growing, and a stock that only needed decent numbers to recover.
The comparison is not exact. March's selloff mixed tariff threats with doubts about AI spending, while this one adds a hot CPI, a 10-year yield above 5.3% and worries about AI debt. That puts more weight on the earnings reports this time.
The earnings calendar
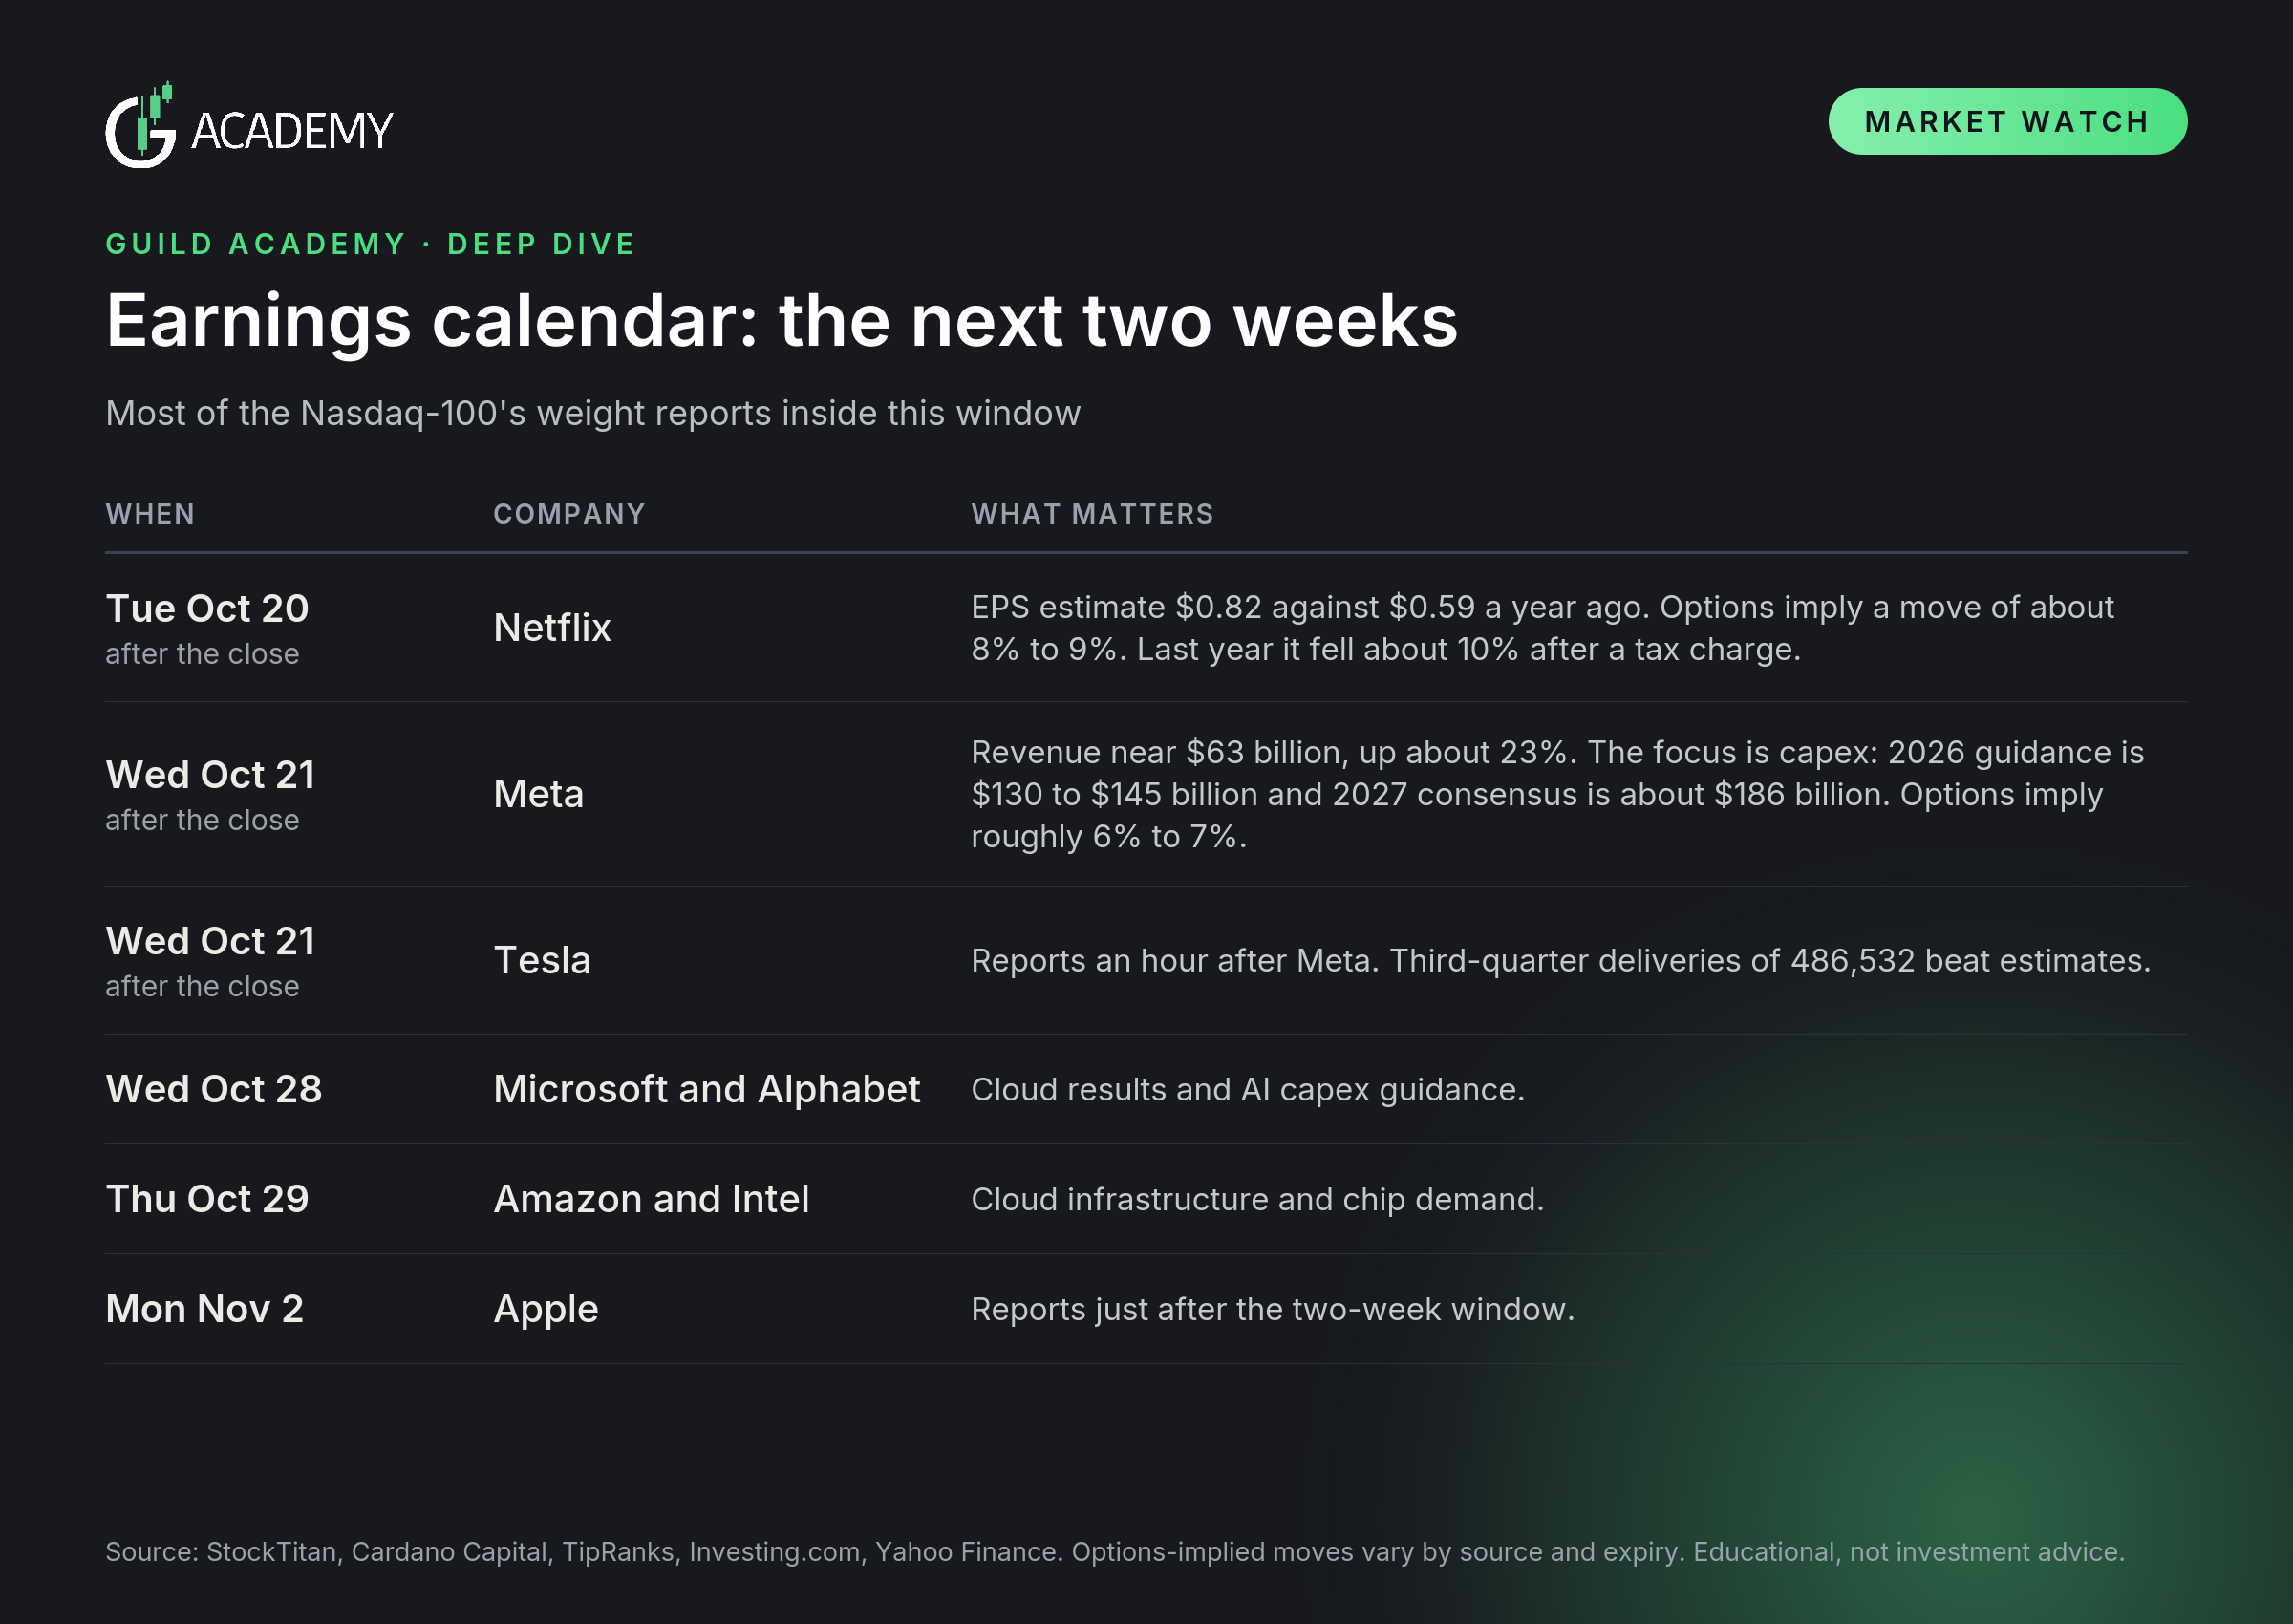
Two weeks of mega-cap reports start tomorrow, and most of the Nasdaq-100's weight reports inside that window.
Trading the reports with options
The approach in these notes is to avoid holding calls through the report, then re-enter once the numbers are out. The logic:
The implied move is the price of the event. It is the at-the-money straddle divided by the stock price. For Meta, estimates run from about 5% to 7% depending on the source and the expiry. Its actual move has topped the options-implied move in roughly three of every four recent reports, and the stock fell about 11% after its October 2025 report and about 8% after July's.
Volatility drops after the report. Option prices include the expected jump. Once the numbers are out, implied volatility falls, so a call can lose value even when the stock moves the right way but by less than was priced.
Selling before the report removes the coin flip. It locks in the result so far and avoids a gap against the position. The cost is giving up the move if it goes your way.
Re-entering afterward uses better information. With the results known and the event premium gone, you can choose a call based on what the option chain is then pricing in.
Risks
Big gaps. Meta fell about 11% after last October's report, and its 2027 capex plan is the swing factor this time. Consensus is about $186 billion, and Bank of America sits at $205 billion.
Macro. September CPI came in at 3.7%, the 10-year yield touched 5.3%, the Fed meets on October 28, and France's budget vote is still ahead.
Cheap can get cheaper. If estimates are cut, the multiple rises even if the price stays put, and the broadening trade can keep running.
The sources disagree on options pricing. Implied moves vary with the expiry used, so check the chain yourself before relying on a number.