Deep Dive: The Midterm Trade, What the Last 20 Years of Data Actually Show
Every midterm election year follows a strikingly similar script: a rough first half, a volatile October, and then a rally that has, historically, never failed to show up. Here's what the actual data says about that pattern, which sectors have genuinely delivered, and where the "sure thing" framing needs a caveat.
The Base Rate Is Real, and It's Not Subtle
Since 1950, midterm years have been the weakest of the four-year presidential cycle, averaging around +4.6% to +7.5% depending on the dataset, well below the roughly +9% to +12% average across all years. That's the uncomfortable first half of the story.
But the back half is where the pattern becomes genuinely remarkable. According to BlackRock's analysis, the S&P 500 has historically returned an average of 14.1% in the six months following a midterm election, as pre-election policy uncertainty resolves. RBC Wealth Management puts the 12-month post-midterm average even higher, at 16.3%. One research note tracking this pattern since 1950 describes the 12 months following a midterm vote as "positive in essentially every instance," averaging 12-15%.
The fourth quarter of a midterm year specifically has been up 86% of the time, the single strongest quarter across the entire four-year cycle, and the full midterm year itself finishes positive roughly 87% of the time despite the rough start.
October's Reputation for Chaos Is Also Backed by Data
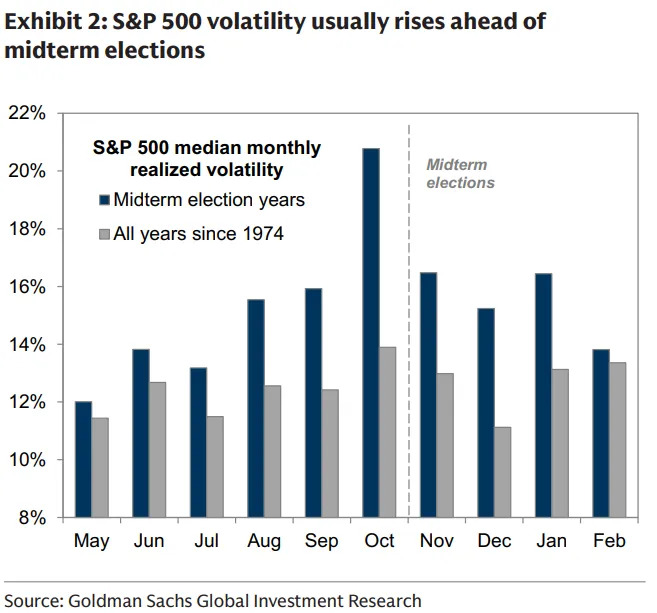
Options-market data shows implied volatility climbing from around 13% early in a midterm year toward 20% as the election approaches, directly reflecting the uncertainty priced into the market. Ironically, October is also nicknamed the market's "bear killer" in trading circles, historically it's often where midterm-year bottoms have formed right before the rally begins.
Healthcare's Streak
Healthcare has a genuinely documented 100% win rate from July through December of midterm election years, every single midterm year on record has seen healthcare finish that stretch higher. BlackRock's broader sector data supports the same conclusion from a different angle, healthcare has averaged +10.7% during midterm years overall, the best of any major sector, with Energy second at +8.9%. Industrials (+0.6%) and Financials (-0.6%) have been the laggards.
If healthcare pulls back toward its July level, that's the setup this pattern says to watch for.
The Overall Trade Logic
Historical patterns should be used as perspective, not as a trading signal. The base rate is genuinely one of the more reliable seasonal patterns in market history, but "reliable" and "guaranteed" aren't the same thing, eleven of the nineteen midterm years since 1950 finished positive, meaning several years didn't, even though the pattern reasserted itself in the following 12 months regardless of party or outcome.