Deep Dive: Is This 2018 Again? Reading the Post-Midterm AI Selloff
Last Thursday, November 5, was Wall Street's worst day in 19 months, and the strange part is how little new information there was. No data surprised, and no company collapsed. Investors simply took a second look at what the midterm results mean for the AI build-out. This report lays out what happened, how it compares with 2018, and what to look for if the pattern repeats.
What Happened on Thursday
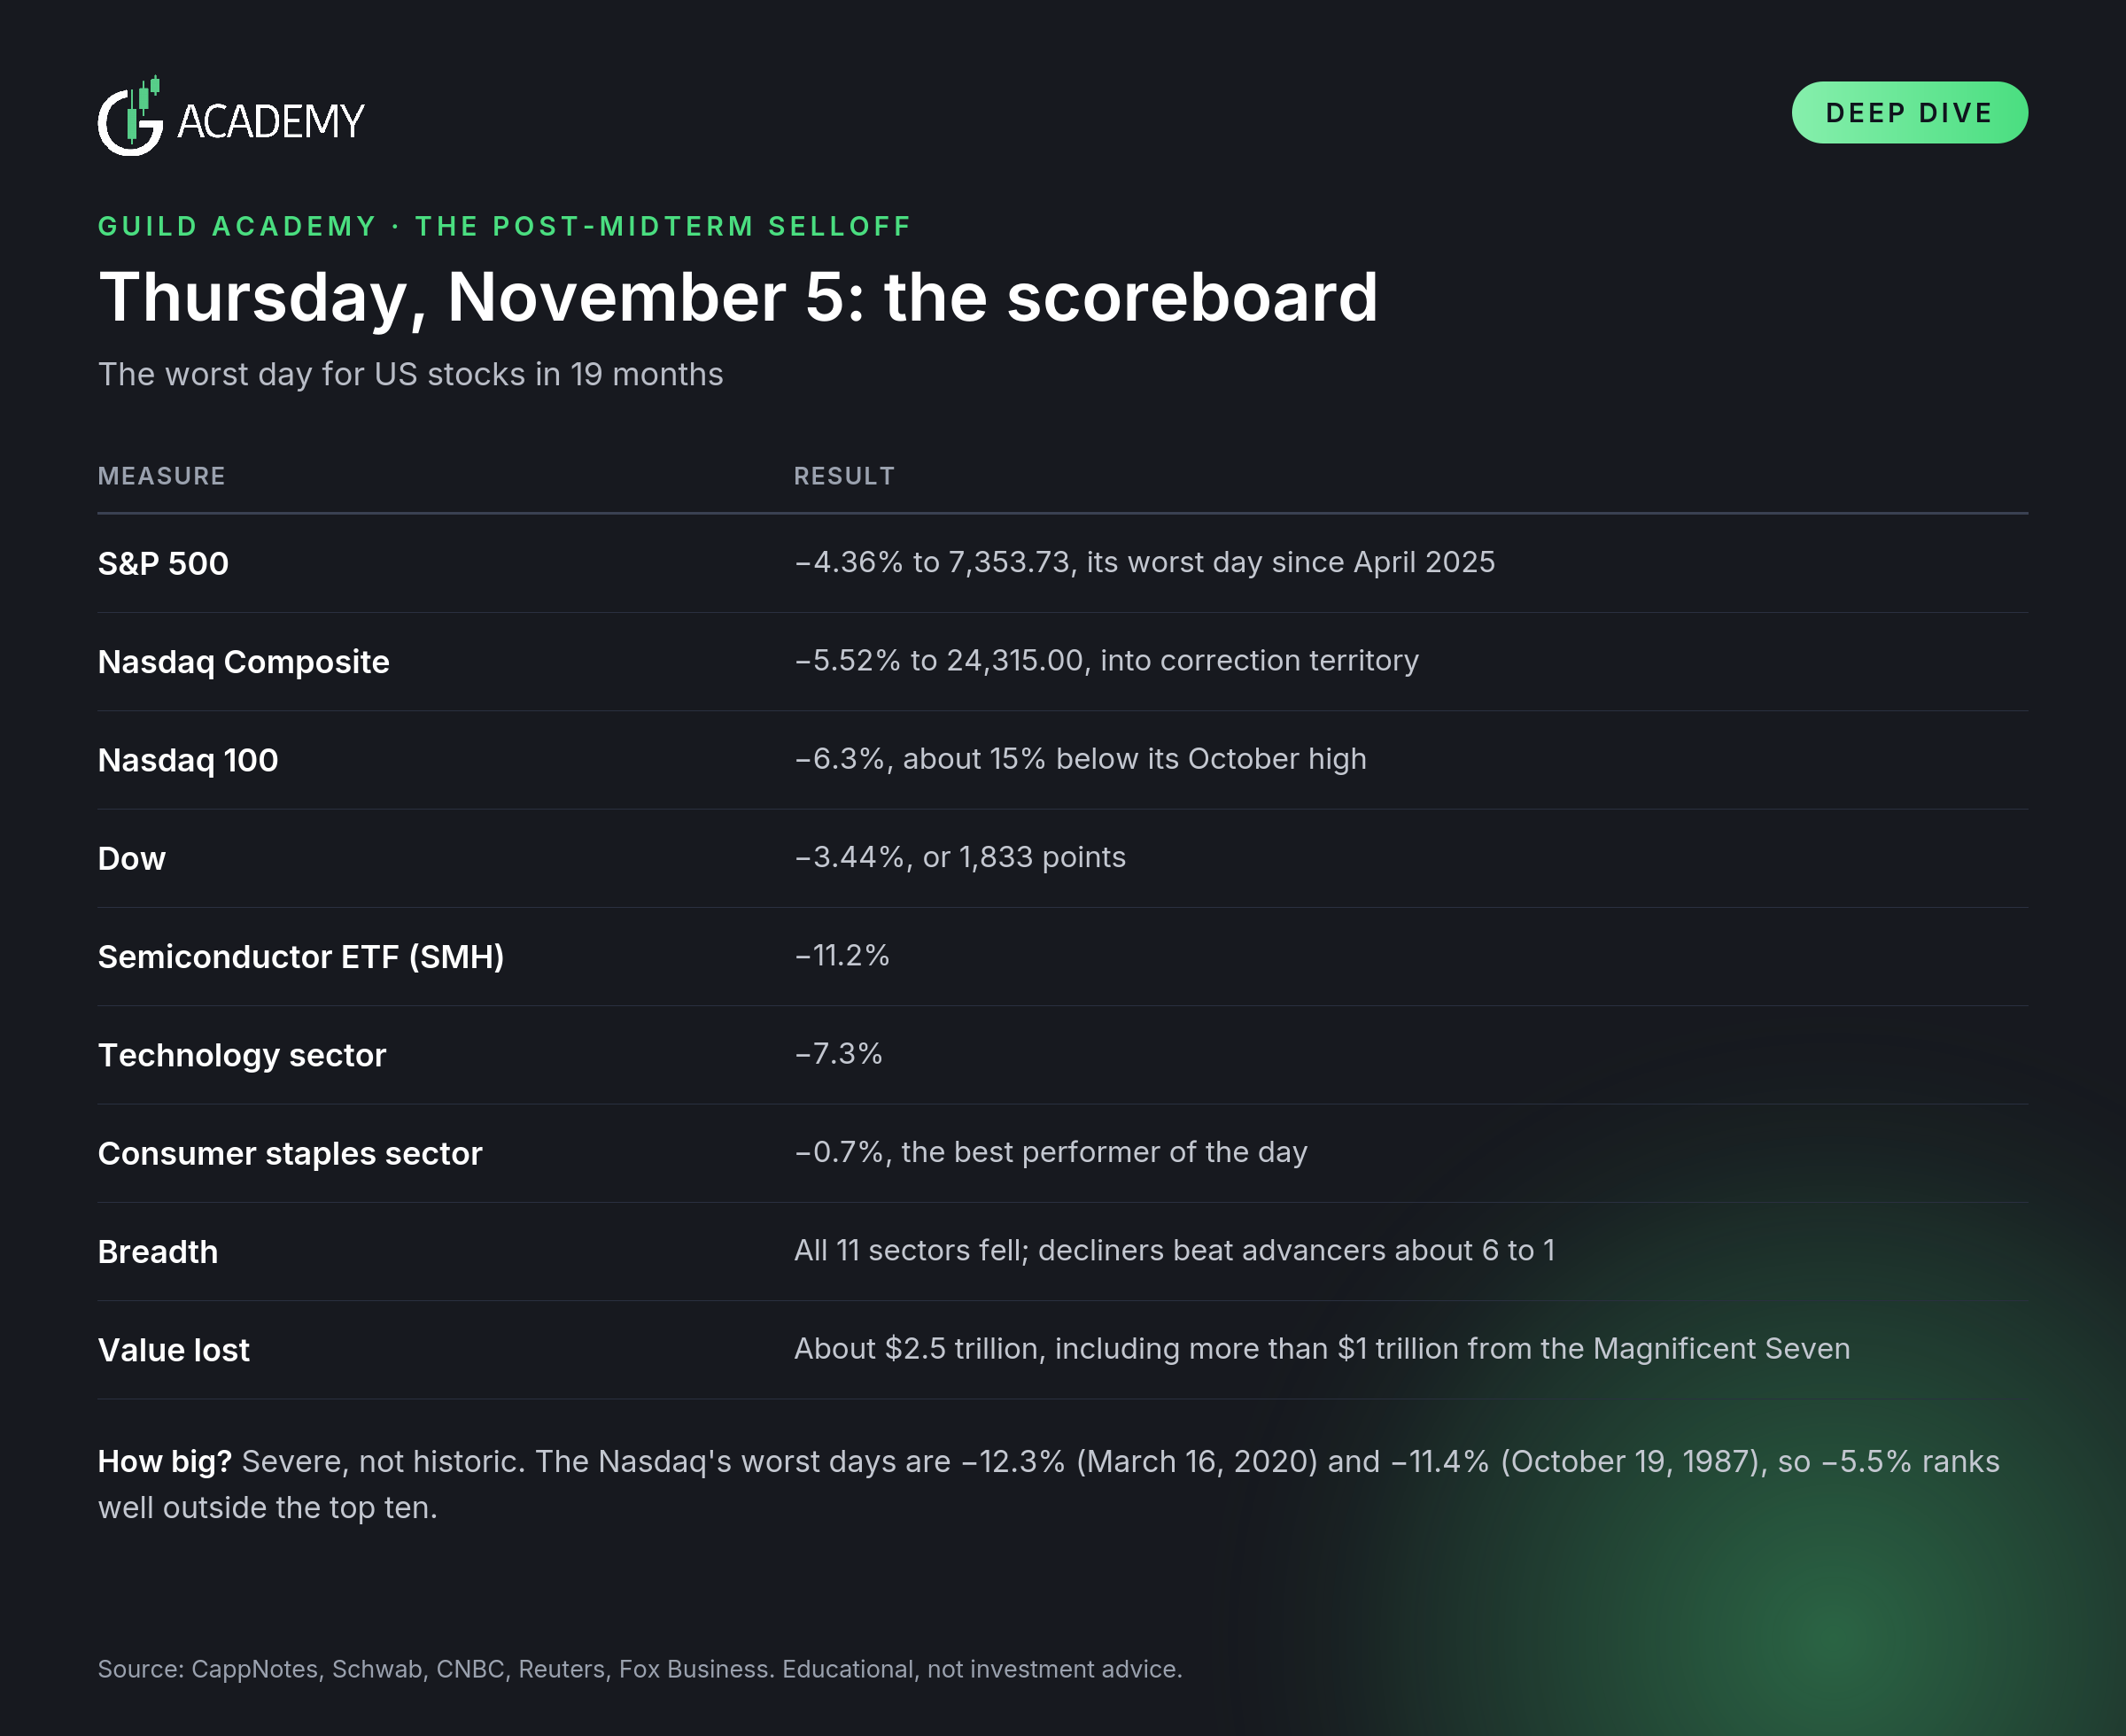
The cause. Wednesday's reaction to the midterms was relief, and the Dow gained 3%. By Thursday, attention had turned to what a Democratic Congress could mean for AI regulation and data center development. Reuters described investors as gripped by fear that Democrats would use their control of both houses to slow the build-out, and chip stocks posted their second-biggest fall on record. Rate traders also pushed the expected timing of the Fed's next hike back to March, and South Korea's Kospi plunged almost 9% at the open on Friday, triggering a trading halt.
How big was it? It was severe but not historic. It was the Nasdaq's worst day since April 2025. The Nasdaq's worst days on record are a 12.3% fall on March 16, 2020 and an 11.4% fall on October 19, 1987, so at 5.5%, Thursday ranks well outside the top ten. The size of the move matters less than what it did: it exposed how much of the market now depends on one trade.
The Week In Numbers
The damage was concentrated, not broad. Chips and AI infrastructure took the hit, while some of the biggest names held up or gained.
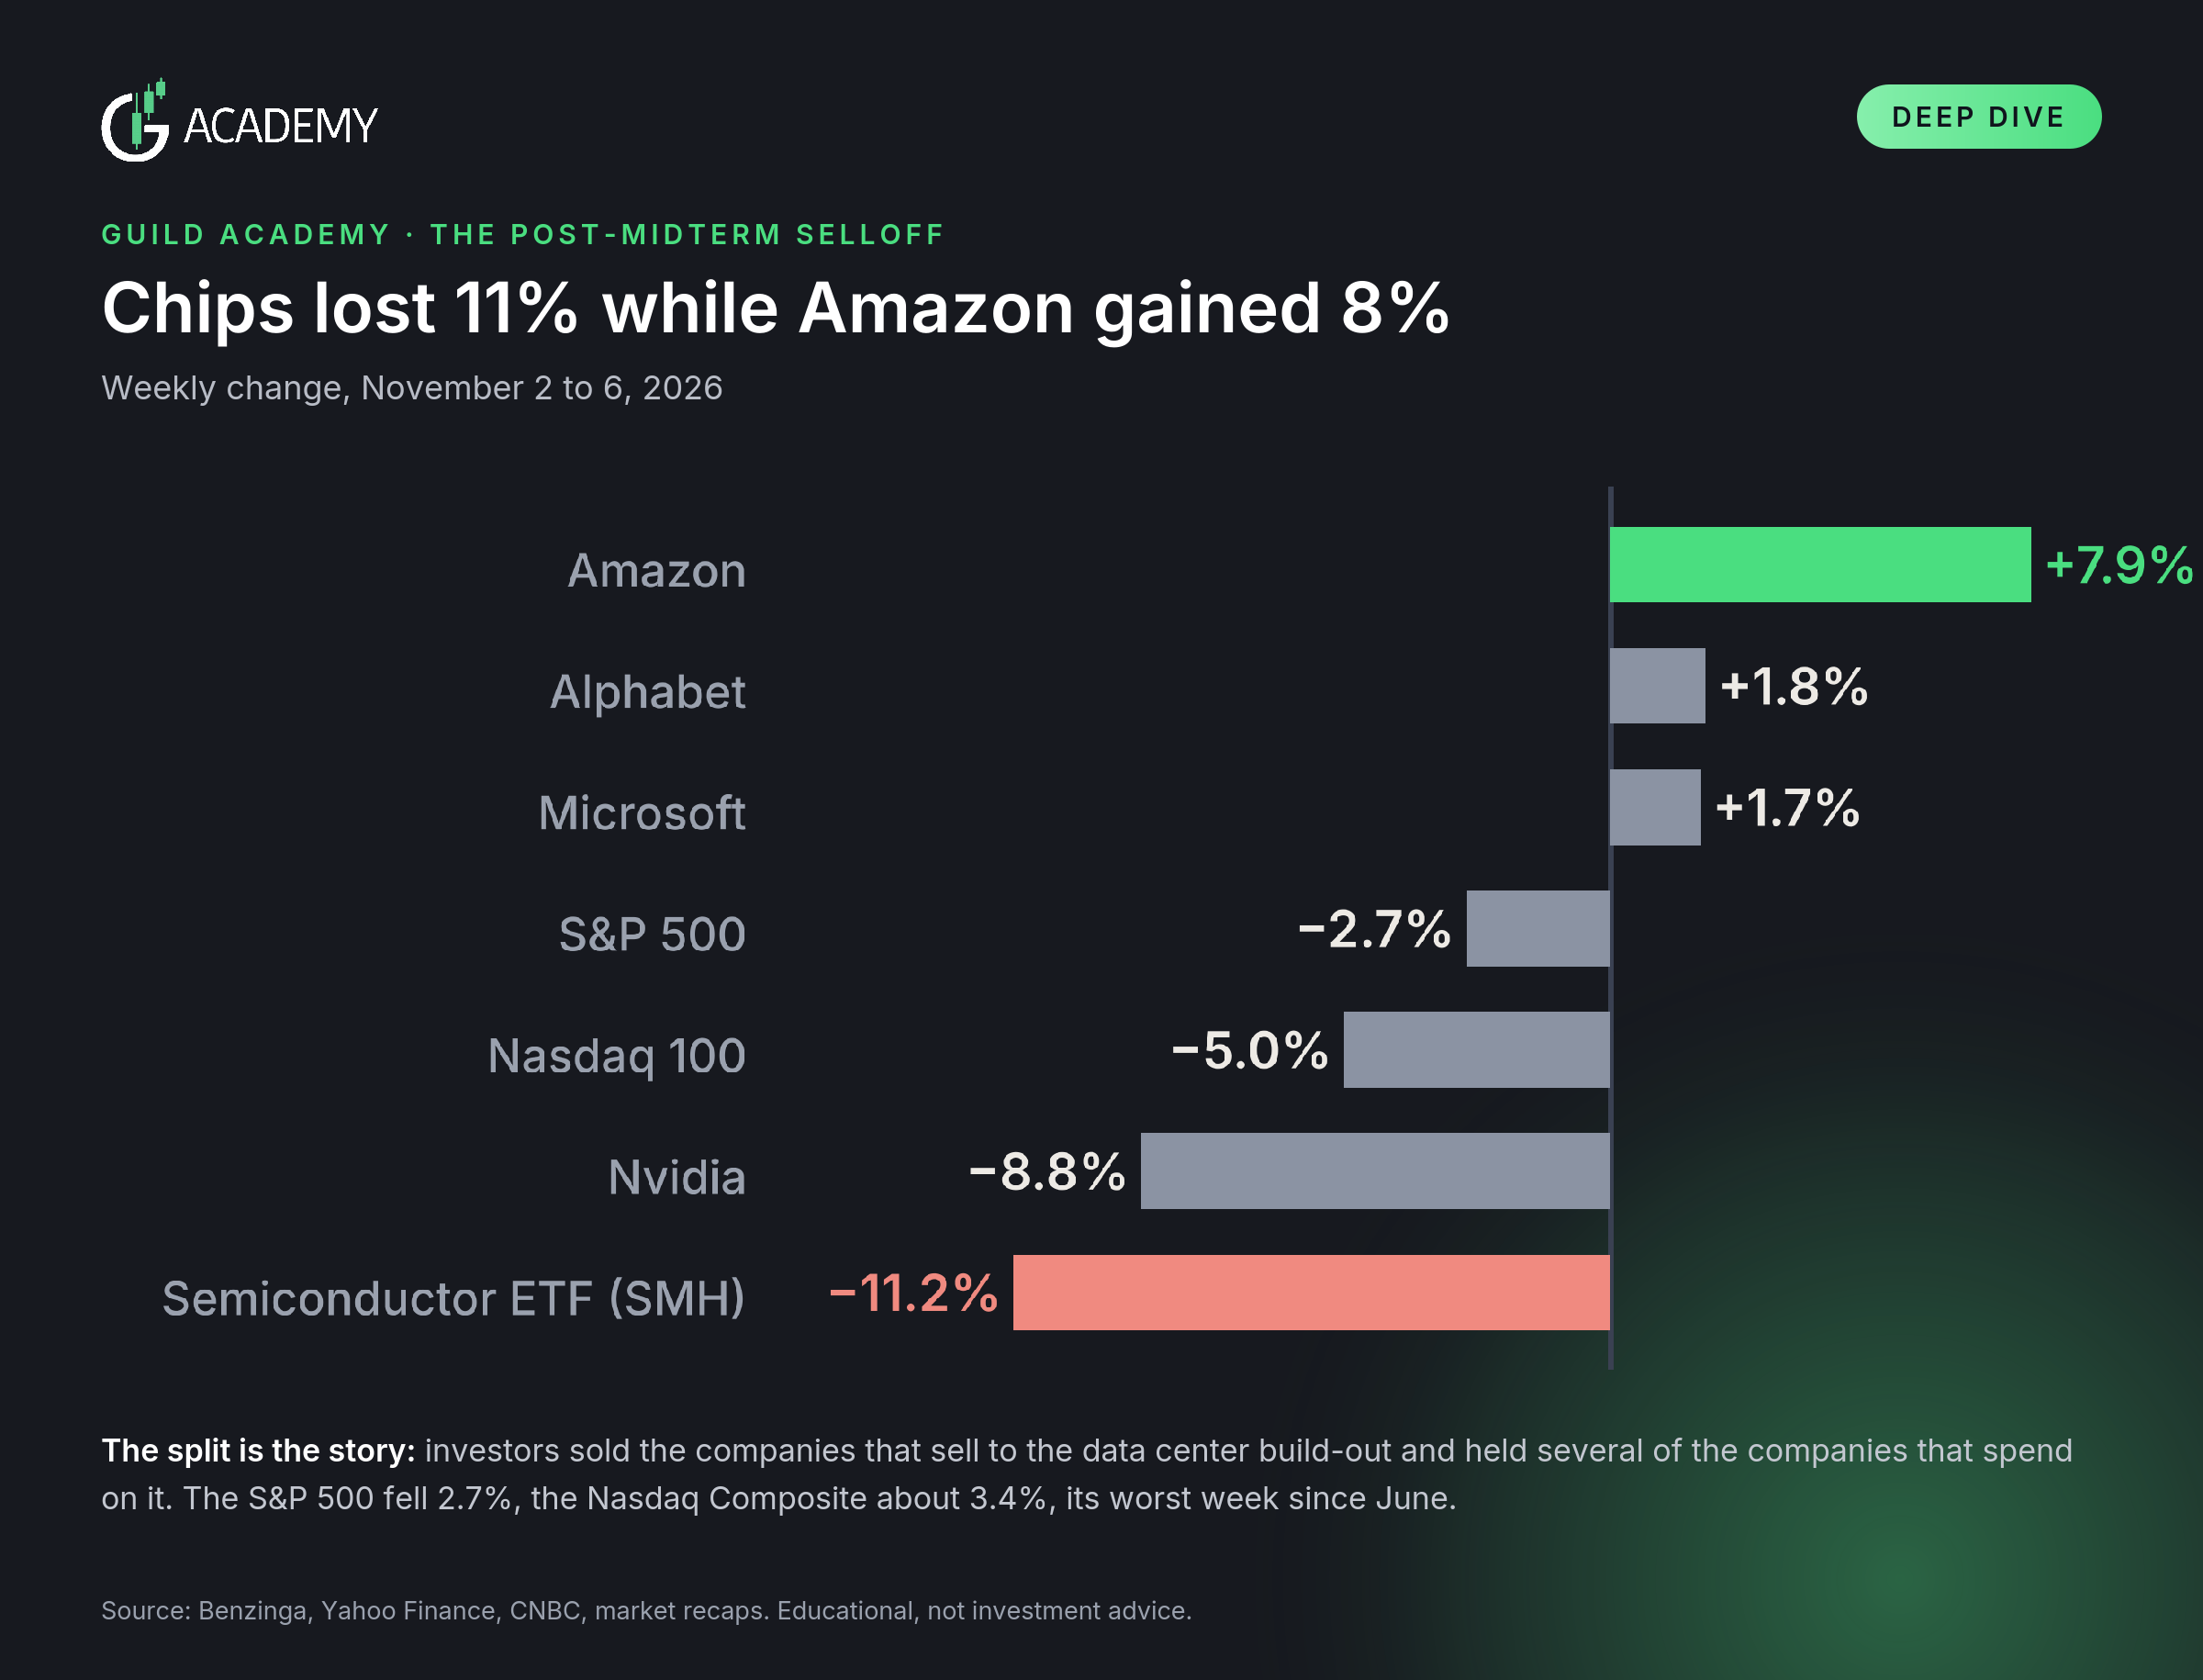
The index hid it. The S&P 500 fell 2.7% for the week, the Dow fell about 0.9% and the Nasdaq Composite fell about 3.4%, its worst week since June.
Friday was a bounce, not a recovery. The Nasdaq rose 1.1% and the semiconductor ETF 3.6%, but all three major averages still ended the week lower. The S&P 500 closed at 7,376.86, about 5.7% below its October 6 record, and the VIX closed at 25.5.
The split is the story. Amazon rose 7.9%, Alphabet 1.8% and Microsoft 1.7%, while Nvidia fell 8.8%. Investors sold the companies that sell to the data center build-out and held several of the companies that spend on it.
The 2018 Comparison
Thursday looked a lot like the post-midterm pattern of 2018. That year, stocks rallied the day after the vote, with the S&P 500 up about 2.1% on November 7, then gave it back as selling resumed. The index did not bottom until December 24, and from the October 31 close to year-end it lost 7.6%. This year, the S&P 500 rose 1.6% on Wednesday and fell 4.4% on Thursday.
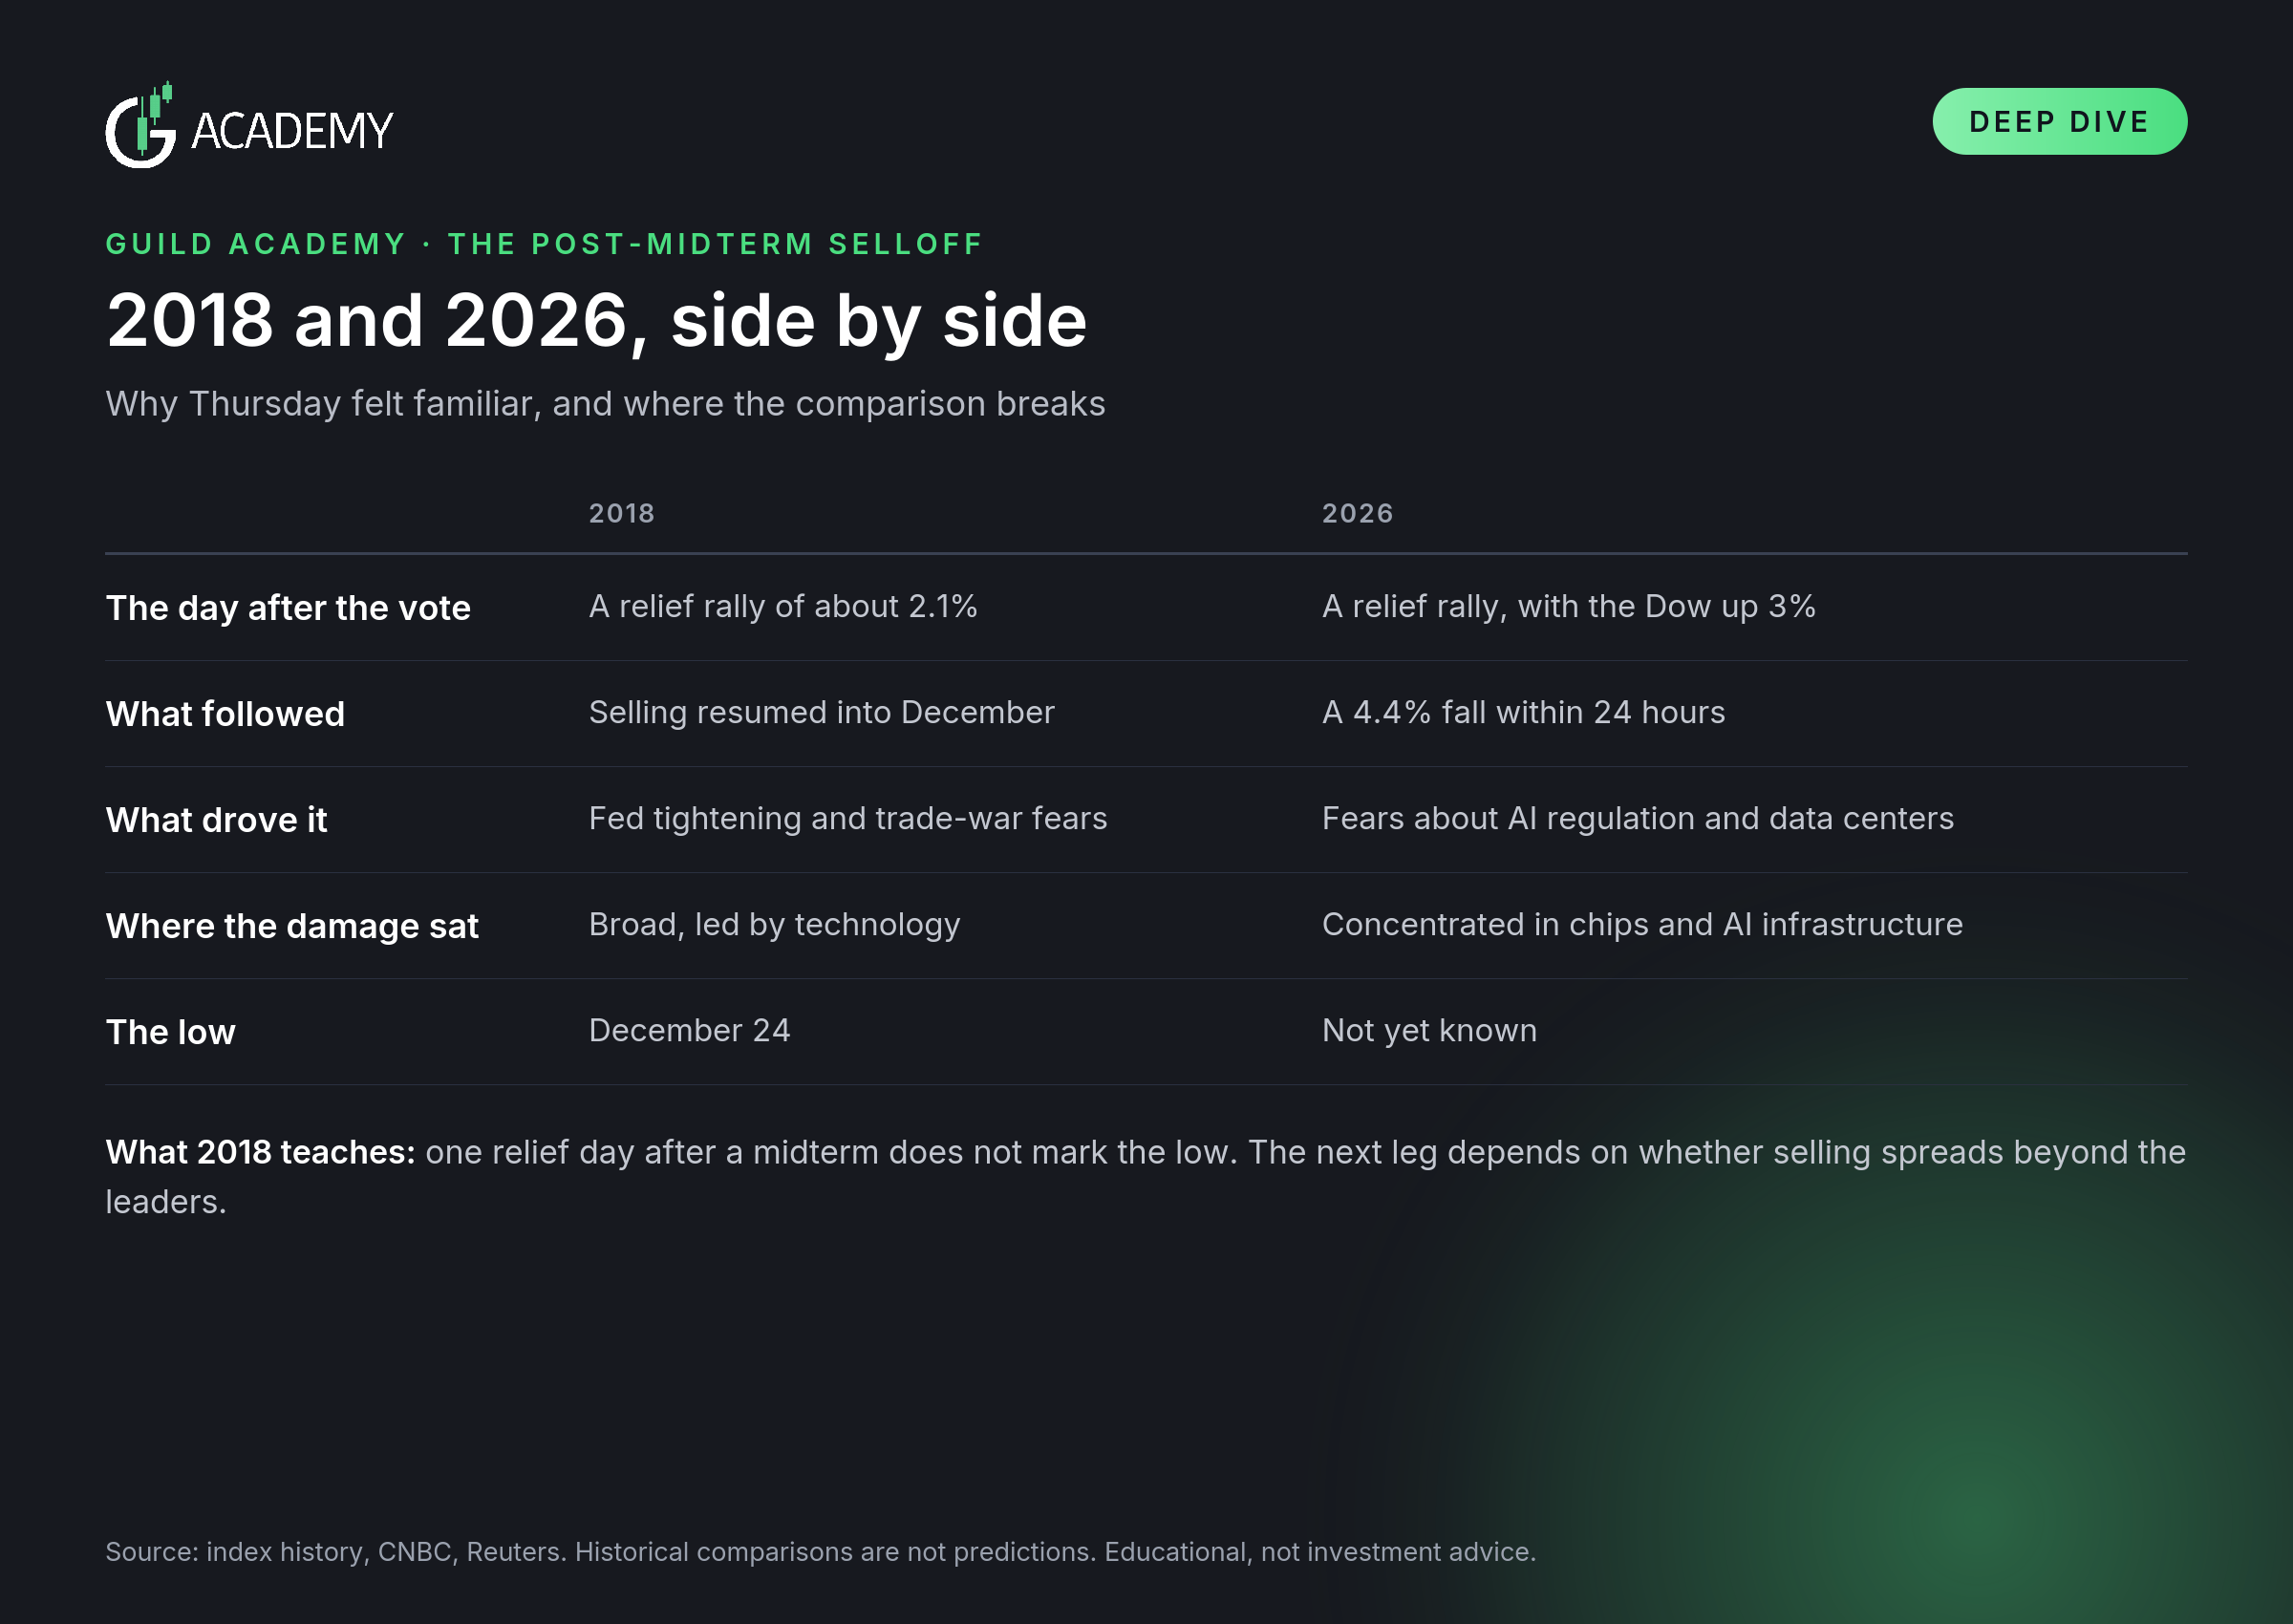
Where the comparison helps: it shows that one relief day after a midterm election does not mark the low. In 2018, the market needed weeks of further selling to find a floor.
Where it breaks down: the causes differ. In 2018, higher interest rates and a trade war weighed on everything. In 2026 the trigger is narrower, a political shift that threatens one industry's growth plans, and the selling has been concentrated in the stocks most tied to it. A narrow shock can fade faster than a broad one, or it can spread if the leaders keep falling. The next few sessions decide which.
The seasonal data also points both ways. Since 1950, the S&P 500 has been higher a year after October 31 in every midterm year, yet in six of 19 years it lost ground between October and year-end, 2018 among them.
The Staples Trade
When AI stocks started to fall in October, the money went to consumer staples, and it went far:
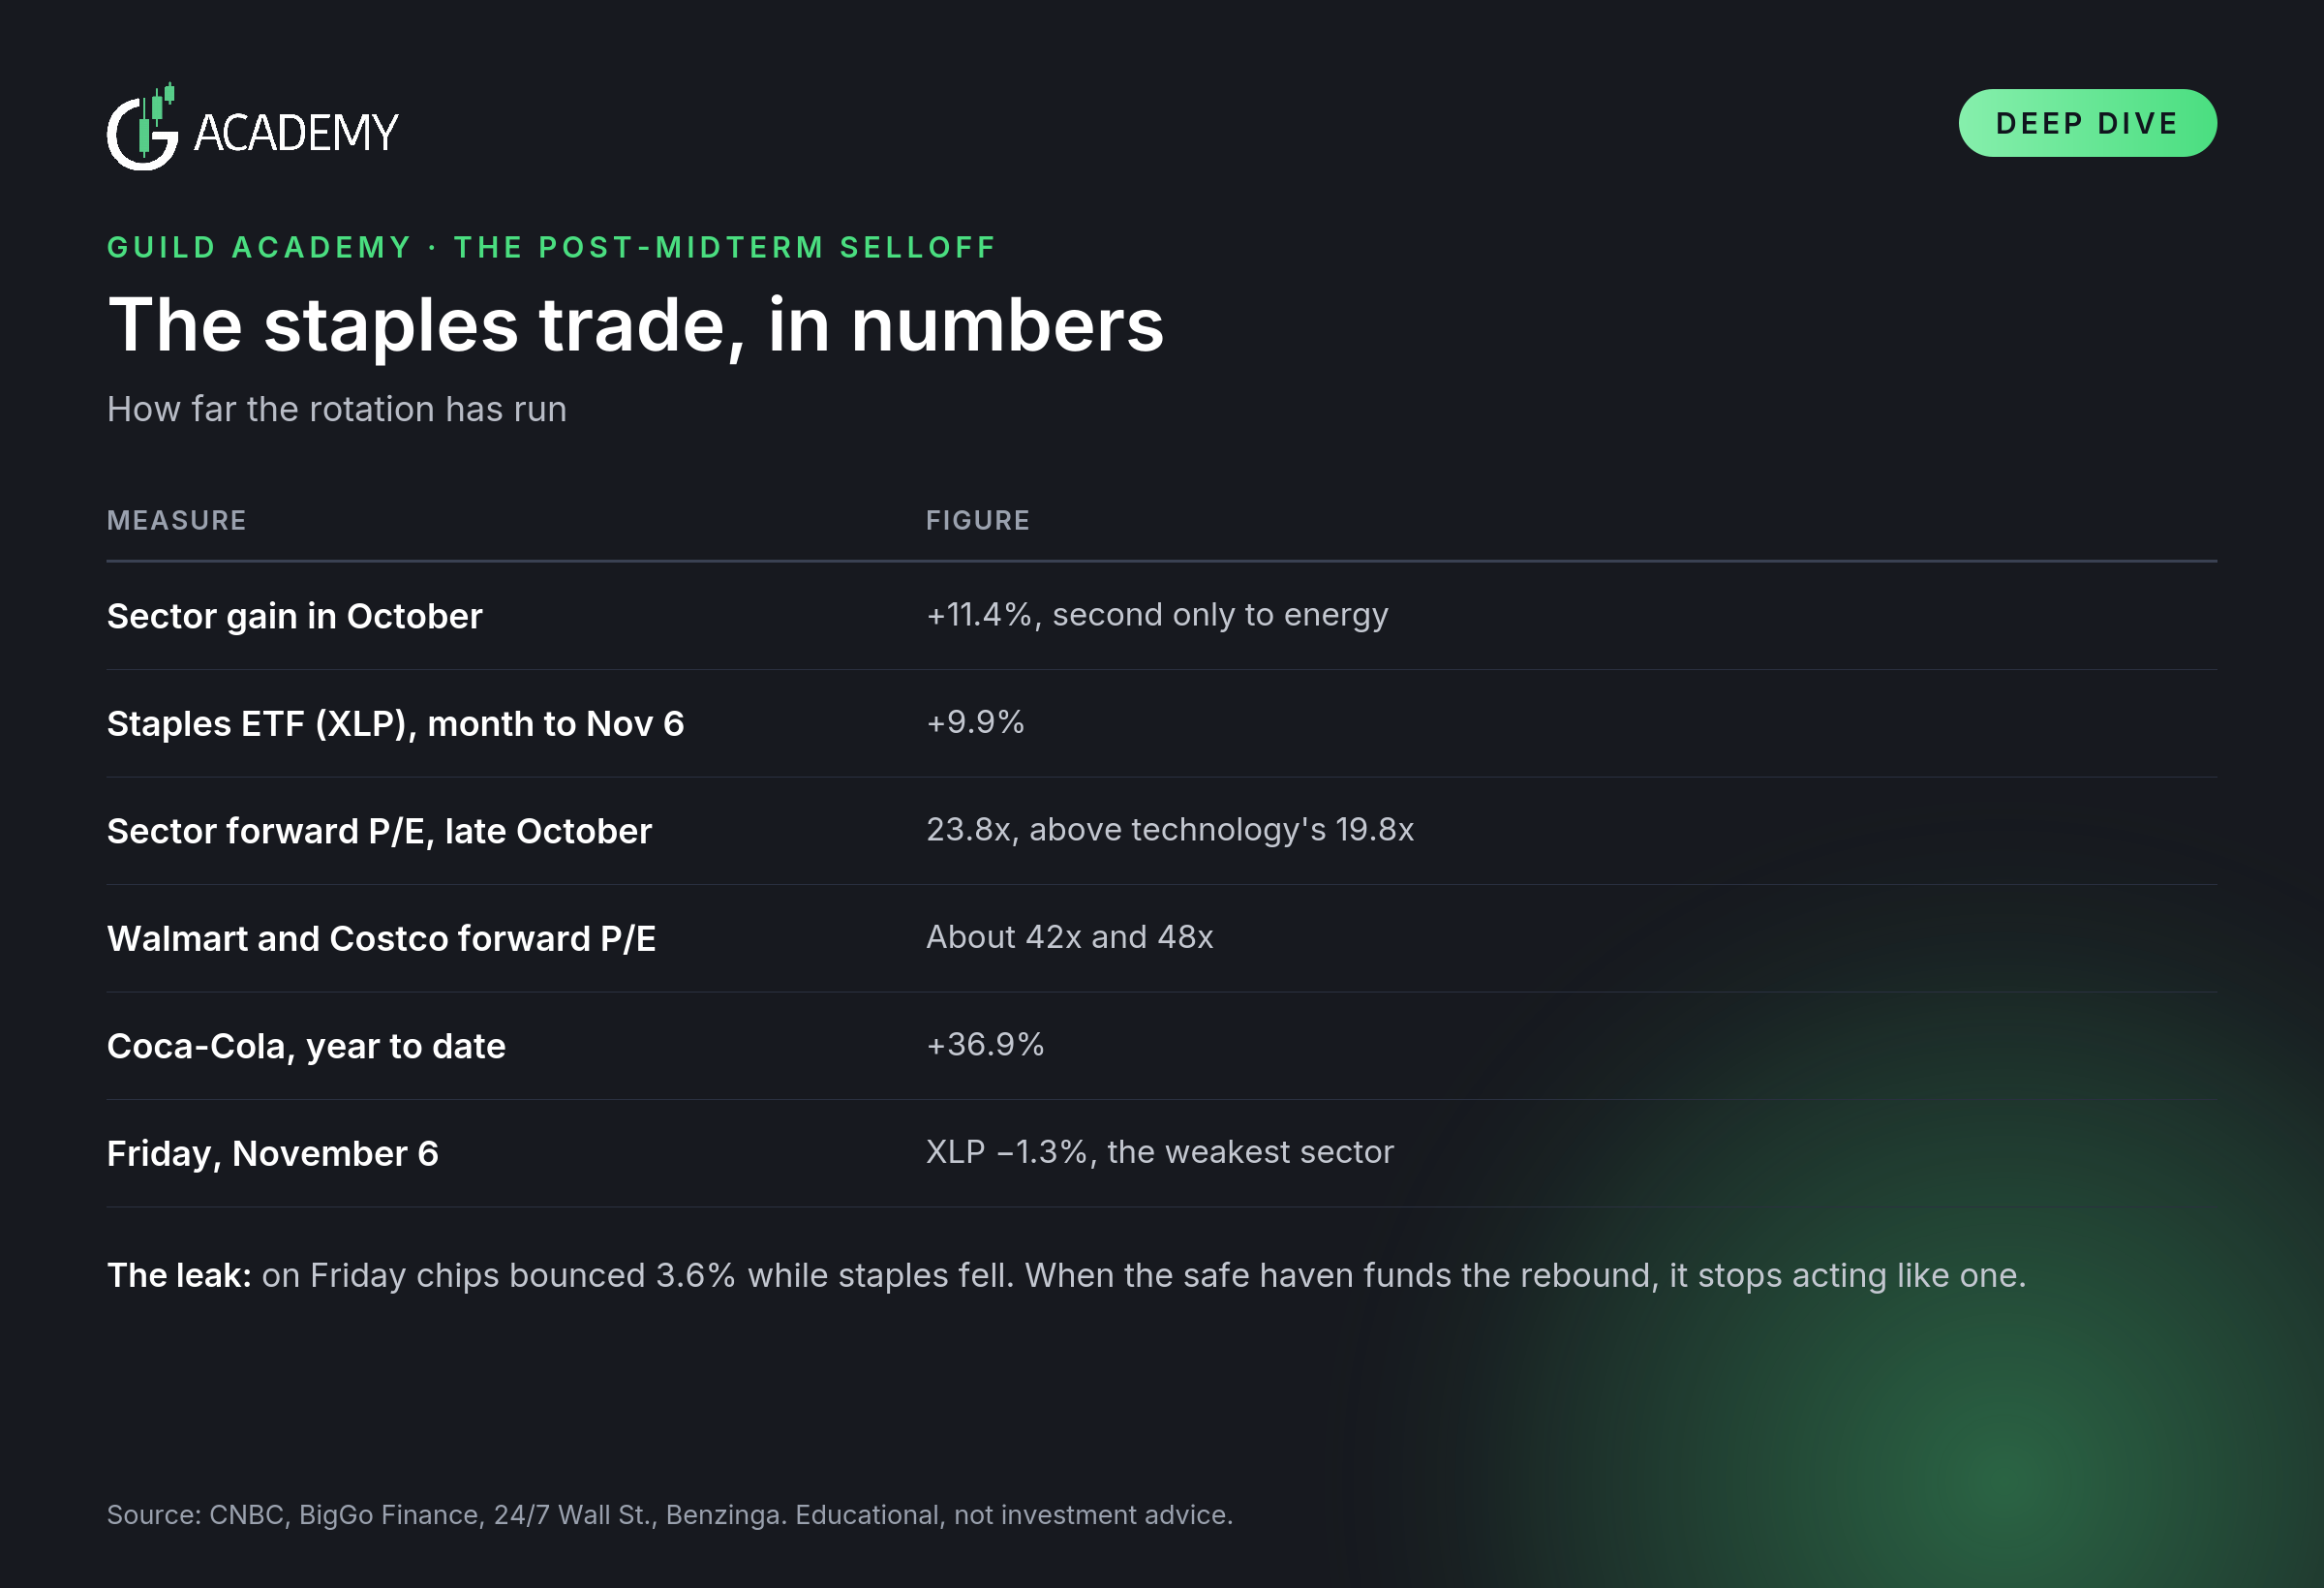
The last row matters. On Friday, chips bounced 3.6% while staples fell, a sign that defensive money was being sold to fund the rebound. When the safe haven becomes the funding source, it is no longer behaving like a safe haven.
The valuation point is the one Jim Chanos made on the evening of November 5. He questioned whether selling high-beta tech stocks that are already down 40% to 70% to buy low-growth consumer names at 30 to 100 times earnings is a smart trade. One outlet has since reported that the post was deleted. The argument stands on its own numbers either way. Staples can hold up in a falling market, because their earnings are steady, but after a run of this size they have less room to keep rising, and most investors who wanted the protection have already bought it.
The Risk-Off Signal
In a rotation, one part of the market falls while another rises, because money moves from one place to another. In a risk-off day, the safe places fall too, and nothing absorbs the money. The signal is a day when the staples ETF (XLP) and the health care ETF (XLV) fall with the market and no other sector rotates higher.
Here is how Thursday and Friday scored against it:
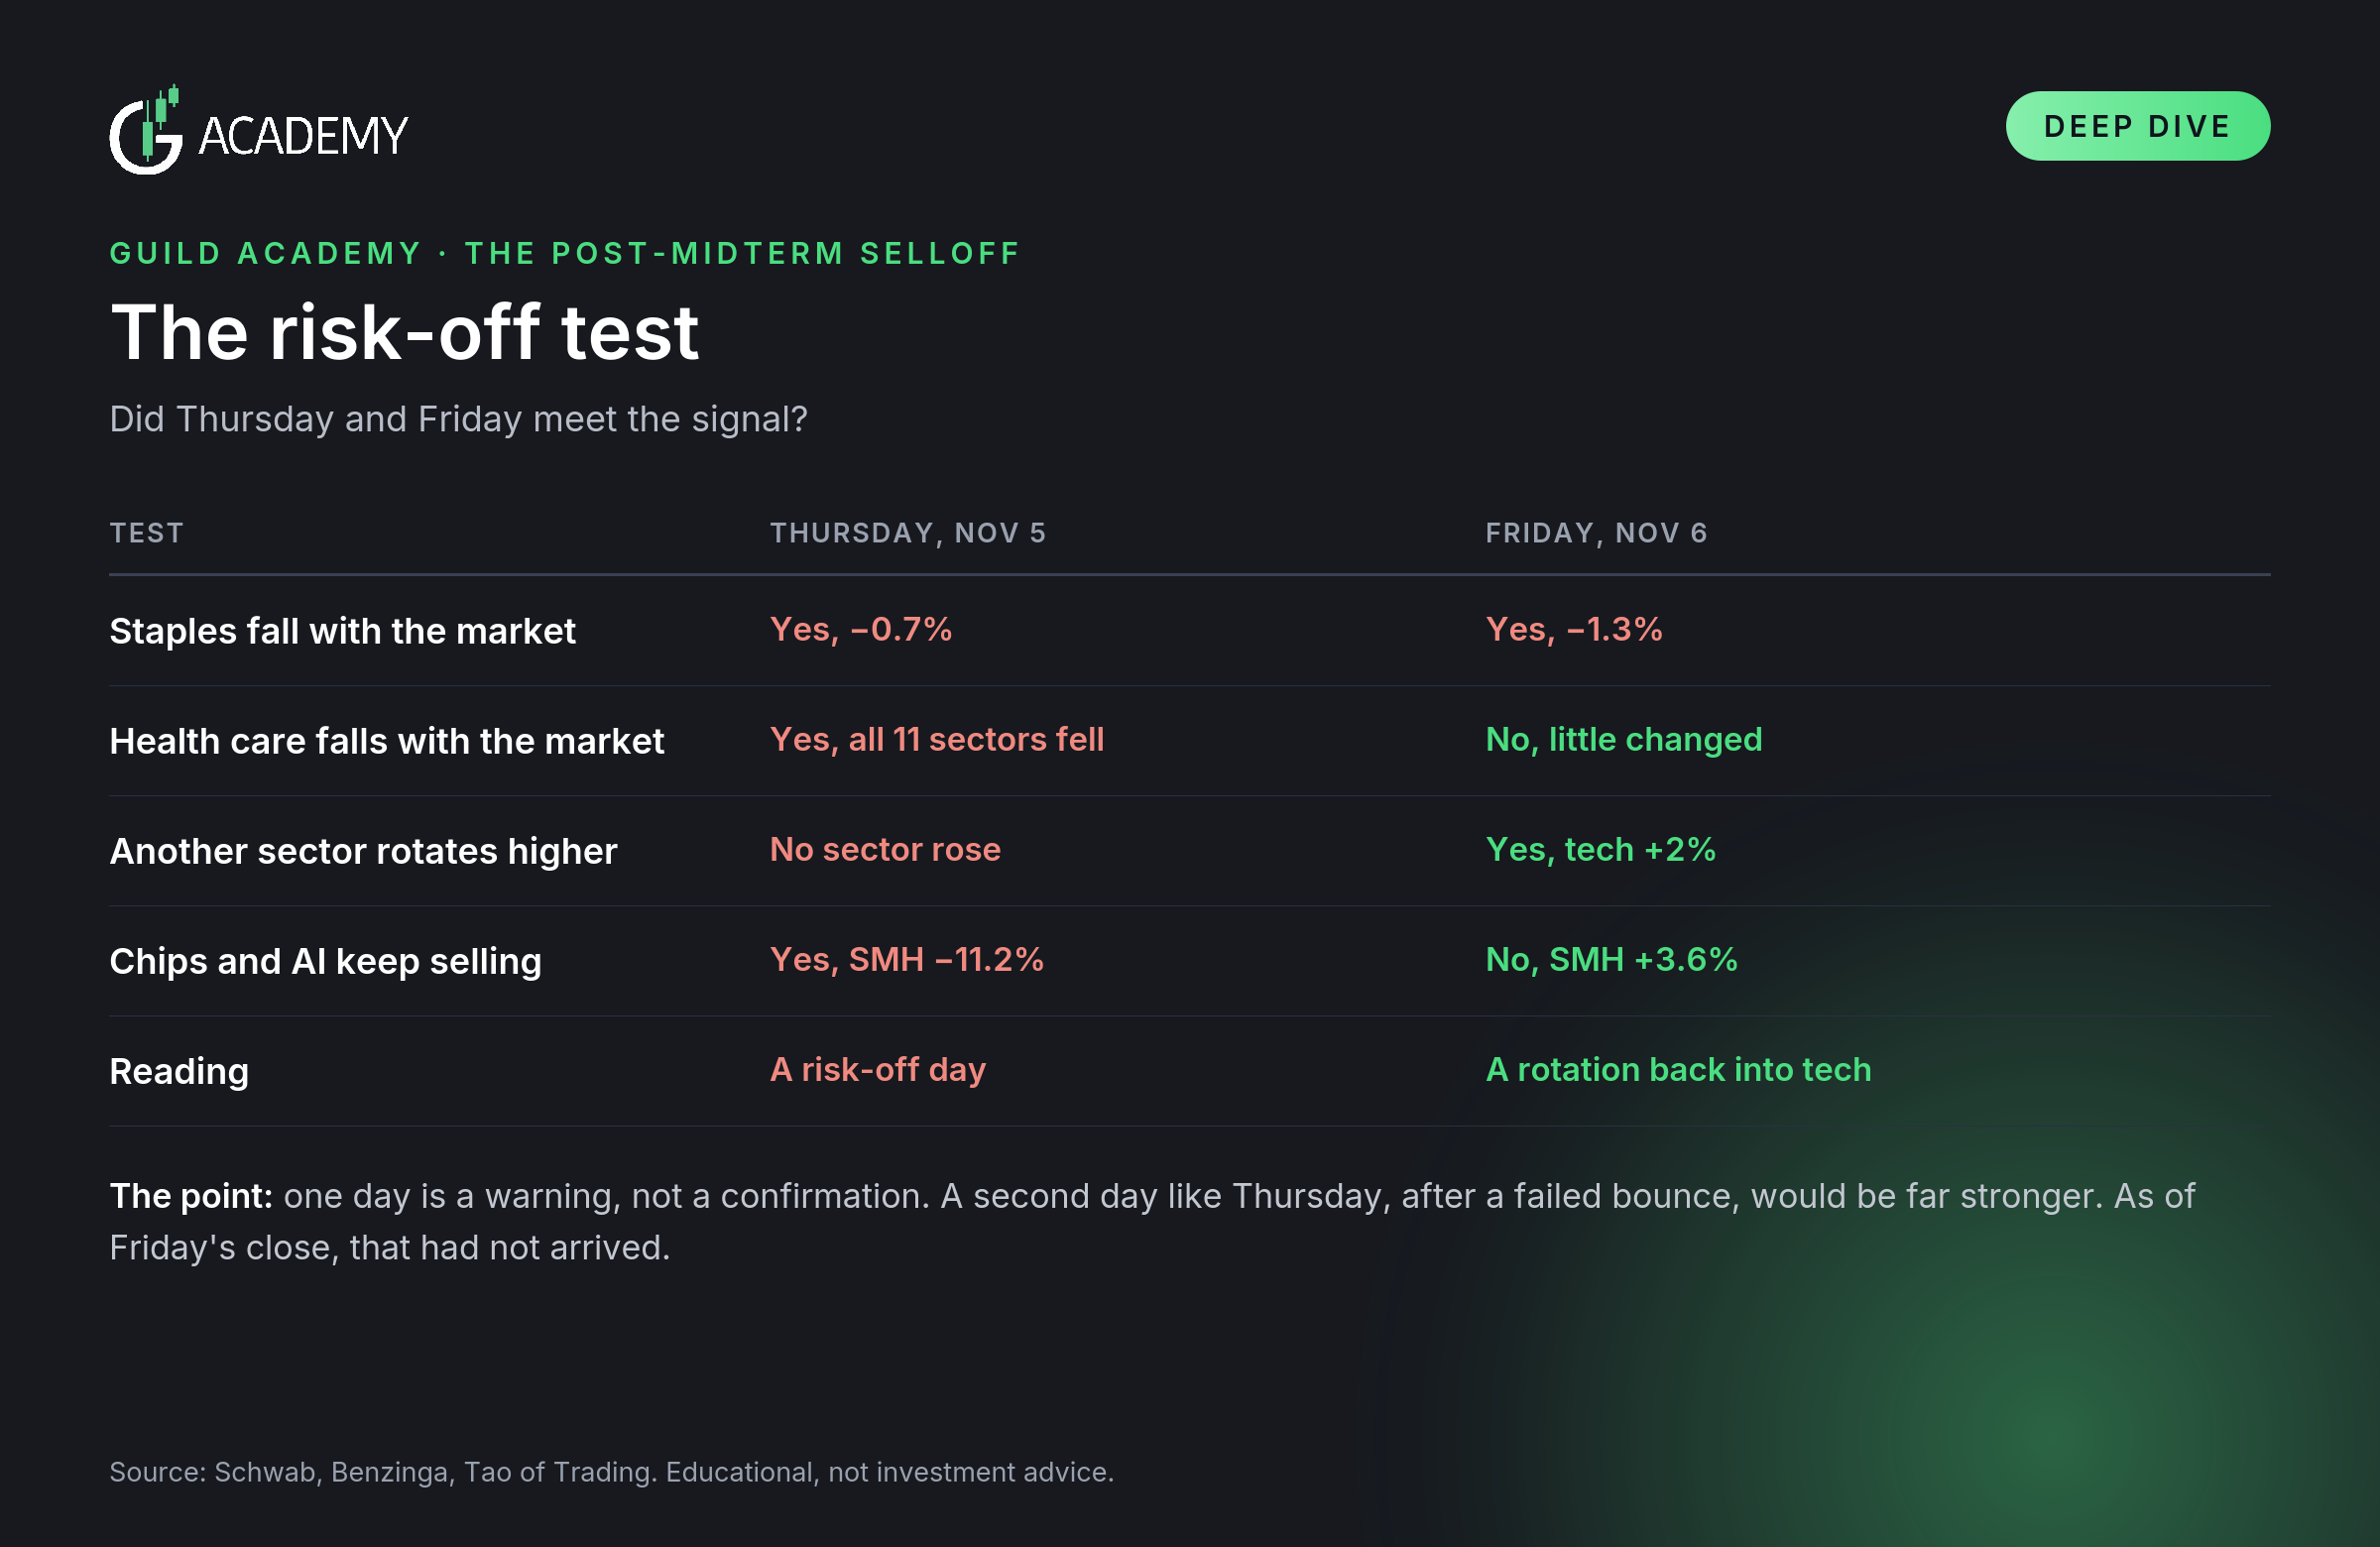
Thursday met the test on its face, since every sector fell. But it was a one-day shock with an identifiable cause, and Friday reversed it. A second day like Thursday, arriving after a failed bounce, would be a much stronger signal than either day alone. As of Friday's close, that confirmation had not arrived.
If it does: do nothing and let the selling run, or position for further downside in the stocks that have fallen least. This is a short-term idea, nothing here is guaranteed or expected,the point is to know what to look for.
The Apple Idea
The reasoning starts with how Apple has behaved this year: it has shrugged off most selloffs, and investors have treated it as a haven from the AI spending boom, because its profits do not depend on building data centers.
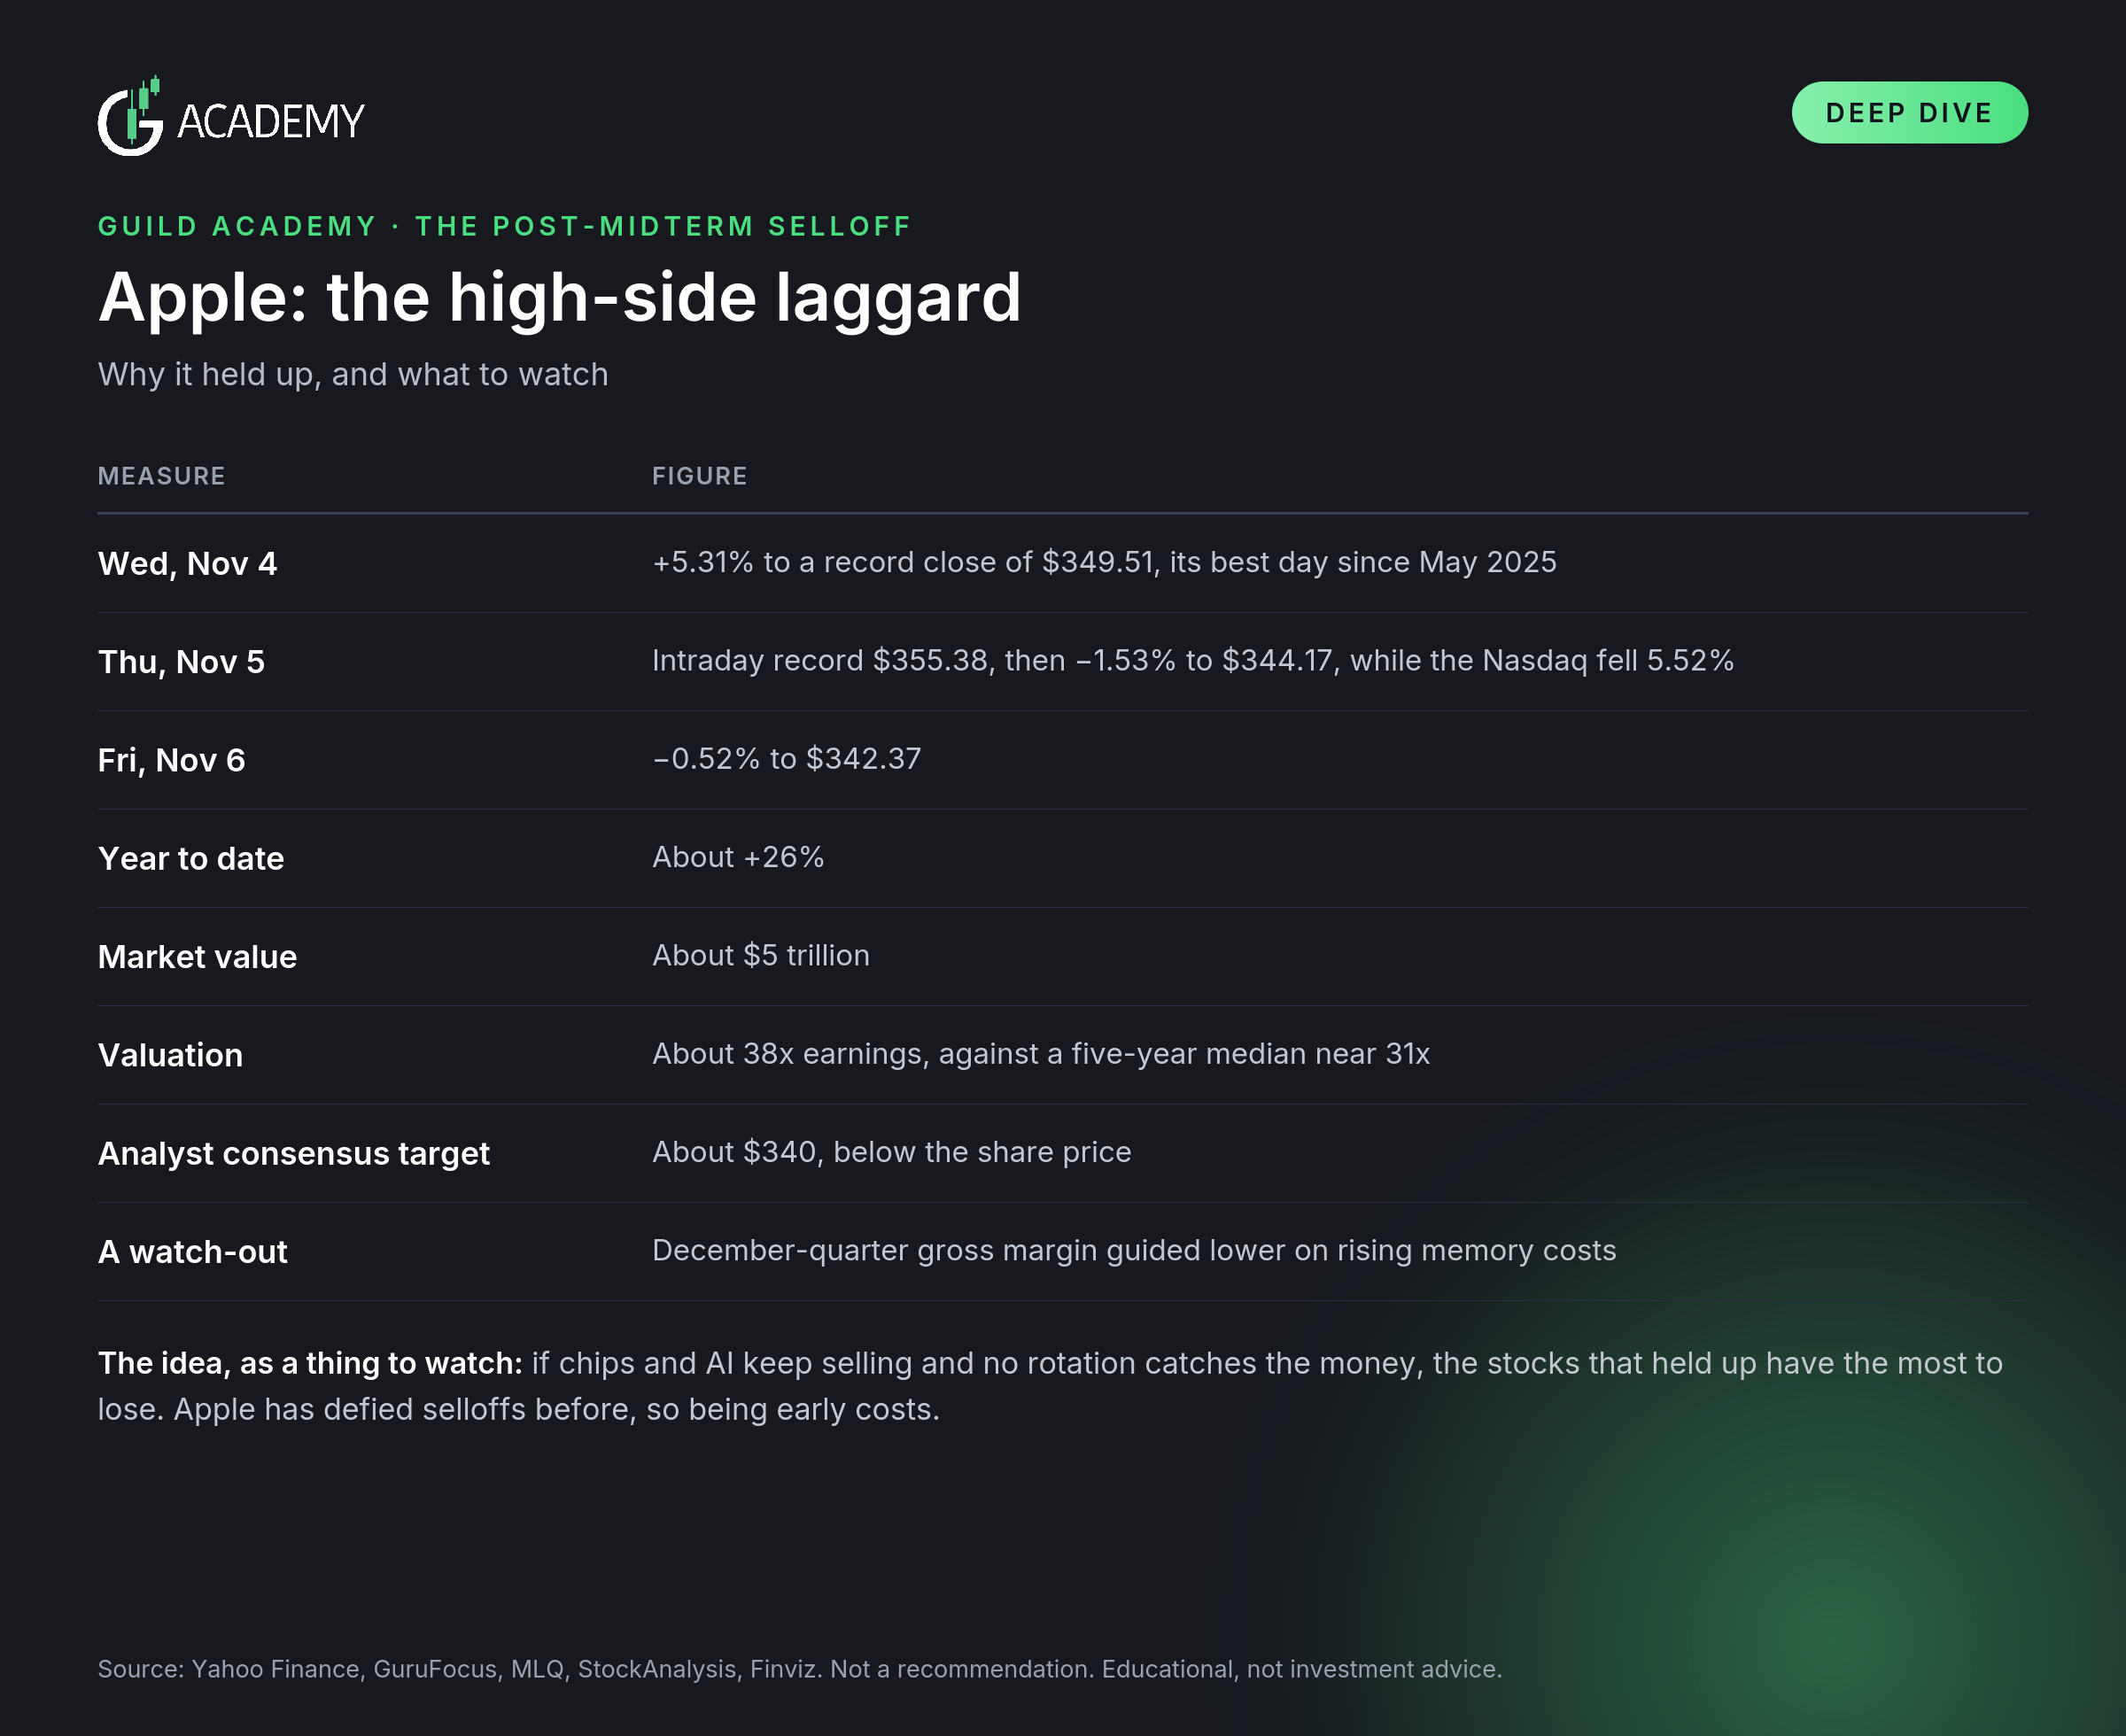
That makes Apple a high-side laggard, a stock that has not fallen with the group. The idea is that when chips and AI keep selling and no rotation catches the money, the stocks that held up are the ones with the most to lose. Apple has been good at ignoring selloffs, but eventually it reacts, and that reaction would mark the point where the move becomes a full risk-off.
This is something to look for, not as a recommendation, and the risks are worth stating plainly:
Apple has repeatedly defied selloffs this year. Being early on this idea has a cost.
Its strength is relative. It still fell on both Thursday and Friday, so it is already reacting a little.
Options expire. A put needs the move to arrive on time, and the whole premium can be lost.
Valuation is not a timing tool. A stock can stay expensive for a long time.
The signal may never come. If the rebound holds, there is nothing to trade, and doing nothing is a legitimate answer.
What to Watch and the Risks
What to watch:
Whether Thursday's low holds. The S&P 500 closed Friday at 7,376.86. One analyst flagged Thursday's low in the SPY ETF near $732.71, and the $730 options level, as the line to watch.
Staples against semiconductors. If defensive stocks keep being sold to fund chip rebounds, as on Friday, the rotation is still in charge. If both fall together, the risk-off signal is building.
Whether the chip bounce lasts. The semiconductor ETF rose 3.6% on Friday after falling 11.2% on Thursday, which is a start and not a recovery.
Data center policy. Any news on regulation, power costs or permitting can restart the selling. OpenAI has already pledged to pay for data center power and change its data center policy after the election.
Rates. Traders now expect the Fed's next hike around March, and a hotter data print could change that.
Apple. A close below Thursday's low would be the first sign that the haven is leaking.
Risks:
The rebound may hold. Nothing in the notes is a forecast, and the comparison with 2018 may not repeat.
Staples may keep working. Expensive sectors can stay expensive.
Options can lose everything. A put position needs both the direction and the timing to be right.
Headlines move fast. A single policy announcement can reverse a week of selling in one session.