Deep Dive: Is a Santa Rally Coming 🎅? What the Seasonal Data Says
A familiar story is about to return to the financial news: the Santa rally. The calendar turns to November, the midterm elections are on Tuesday, and AI stocks have spent the week selling off. Seasonal history points the other way. This report lays out what the data says about the months ahead, why this year's backdrop is unusual, and why a rally could show up in individual industries even if the index does not reflect it.
The Seasonal Case
The argument rests on how the market has behaved after the end of October in midterm years. These are the main figures since 1950:
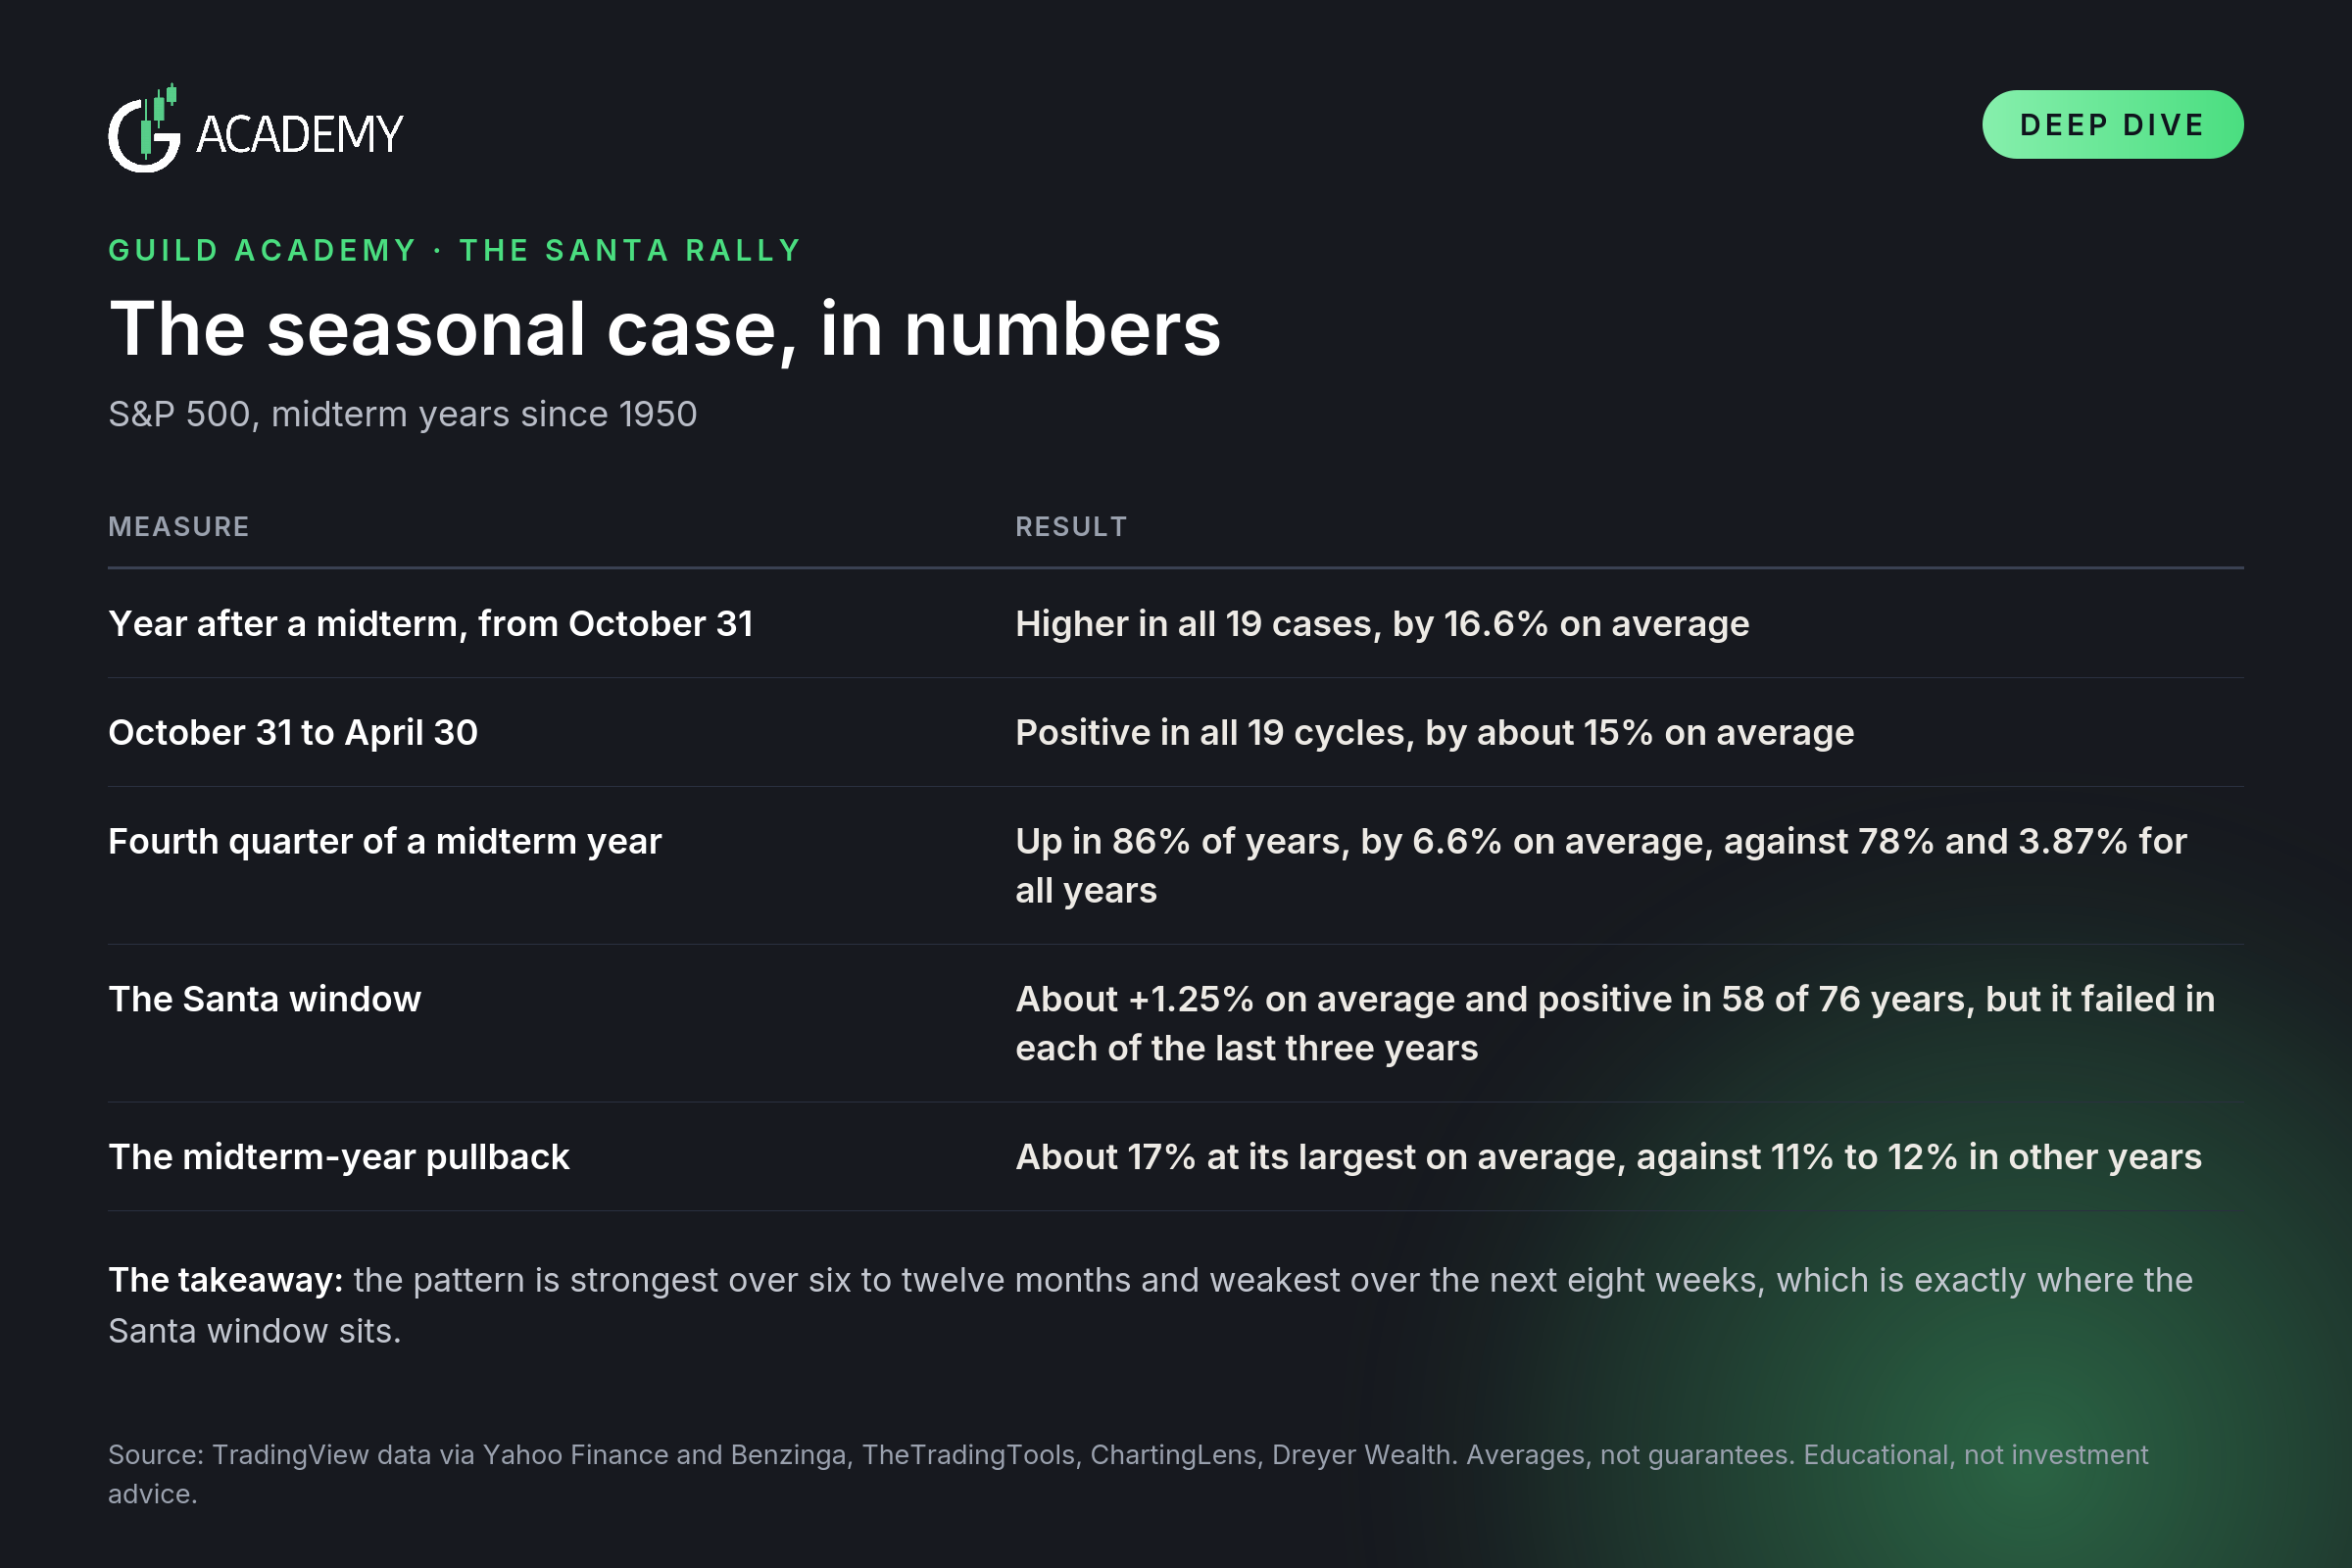
The pattern is strongest over six to twelve months and weakest over the next eight weeks, which is exactly where the Santa window sits.
What History Says
The short-term picture is messier than the headline statistic. From the October close to year-end, the S&P 500 rose in 13 of 19 midterm years, but it lost ground in six of them, including 1974, 2018 and 2022.
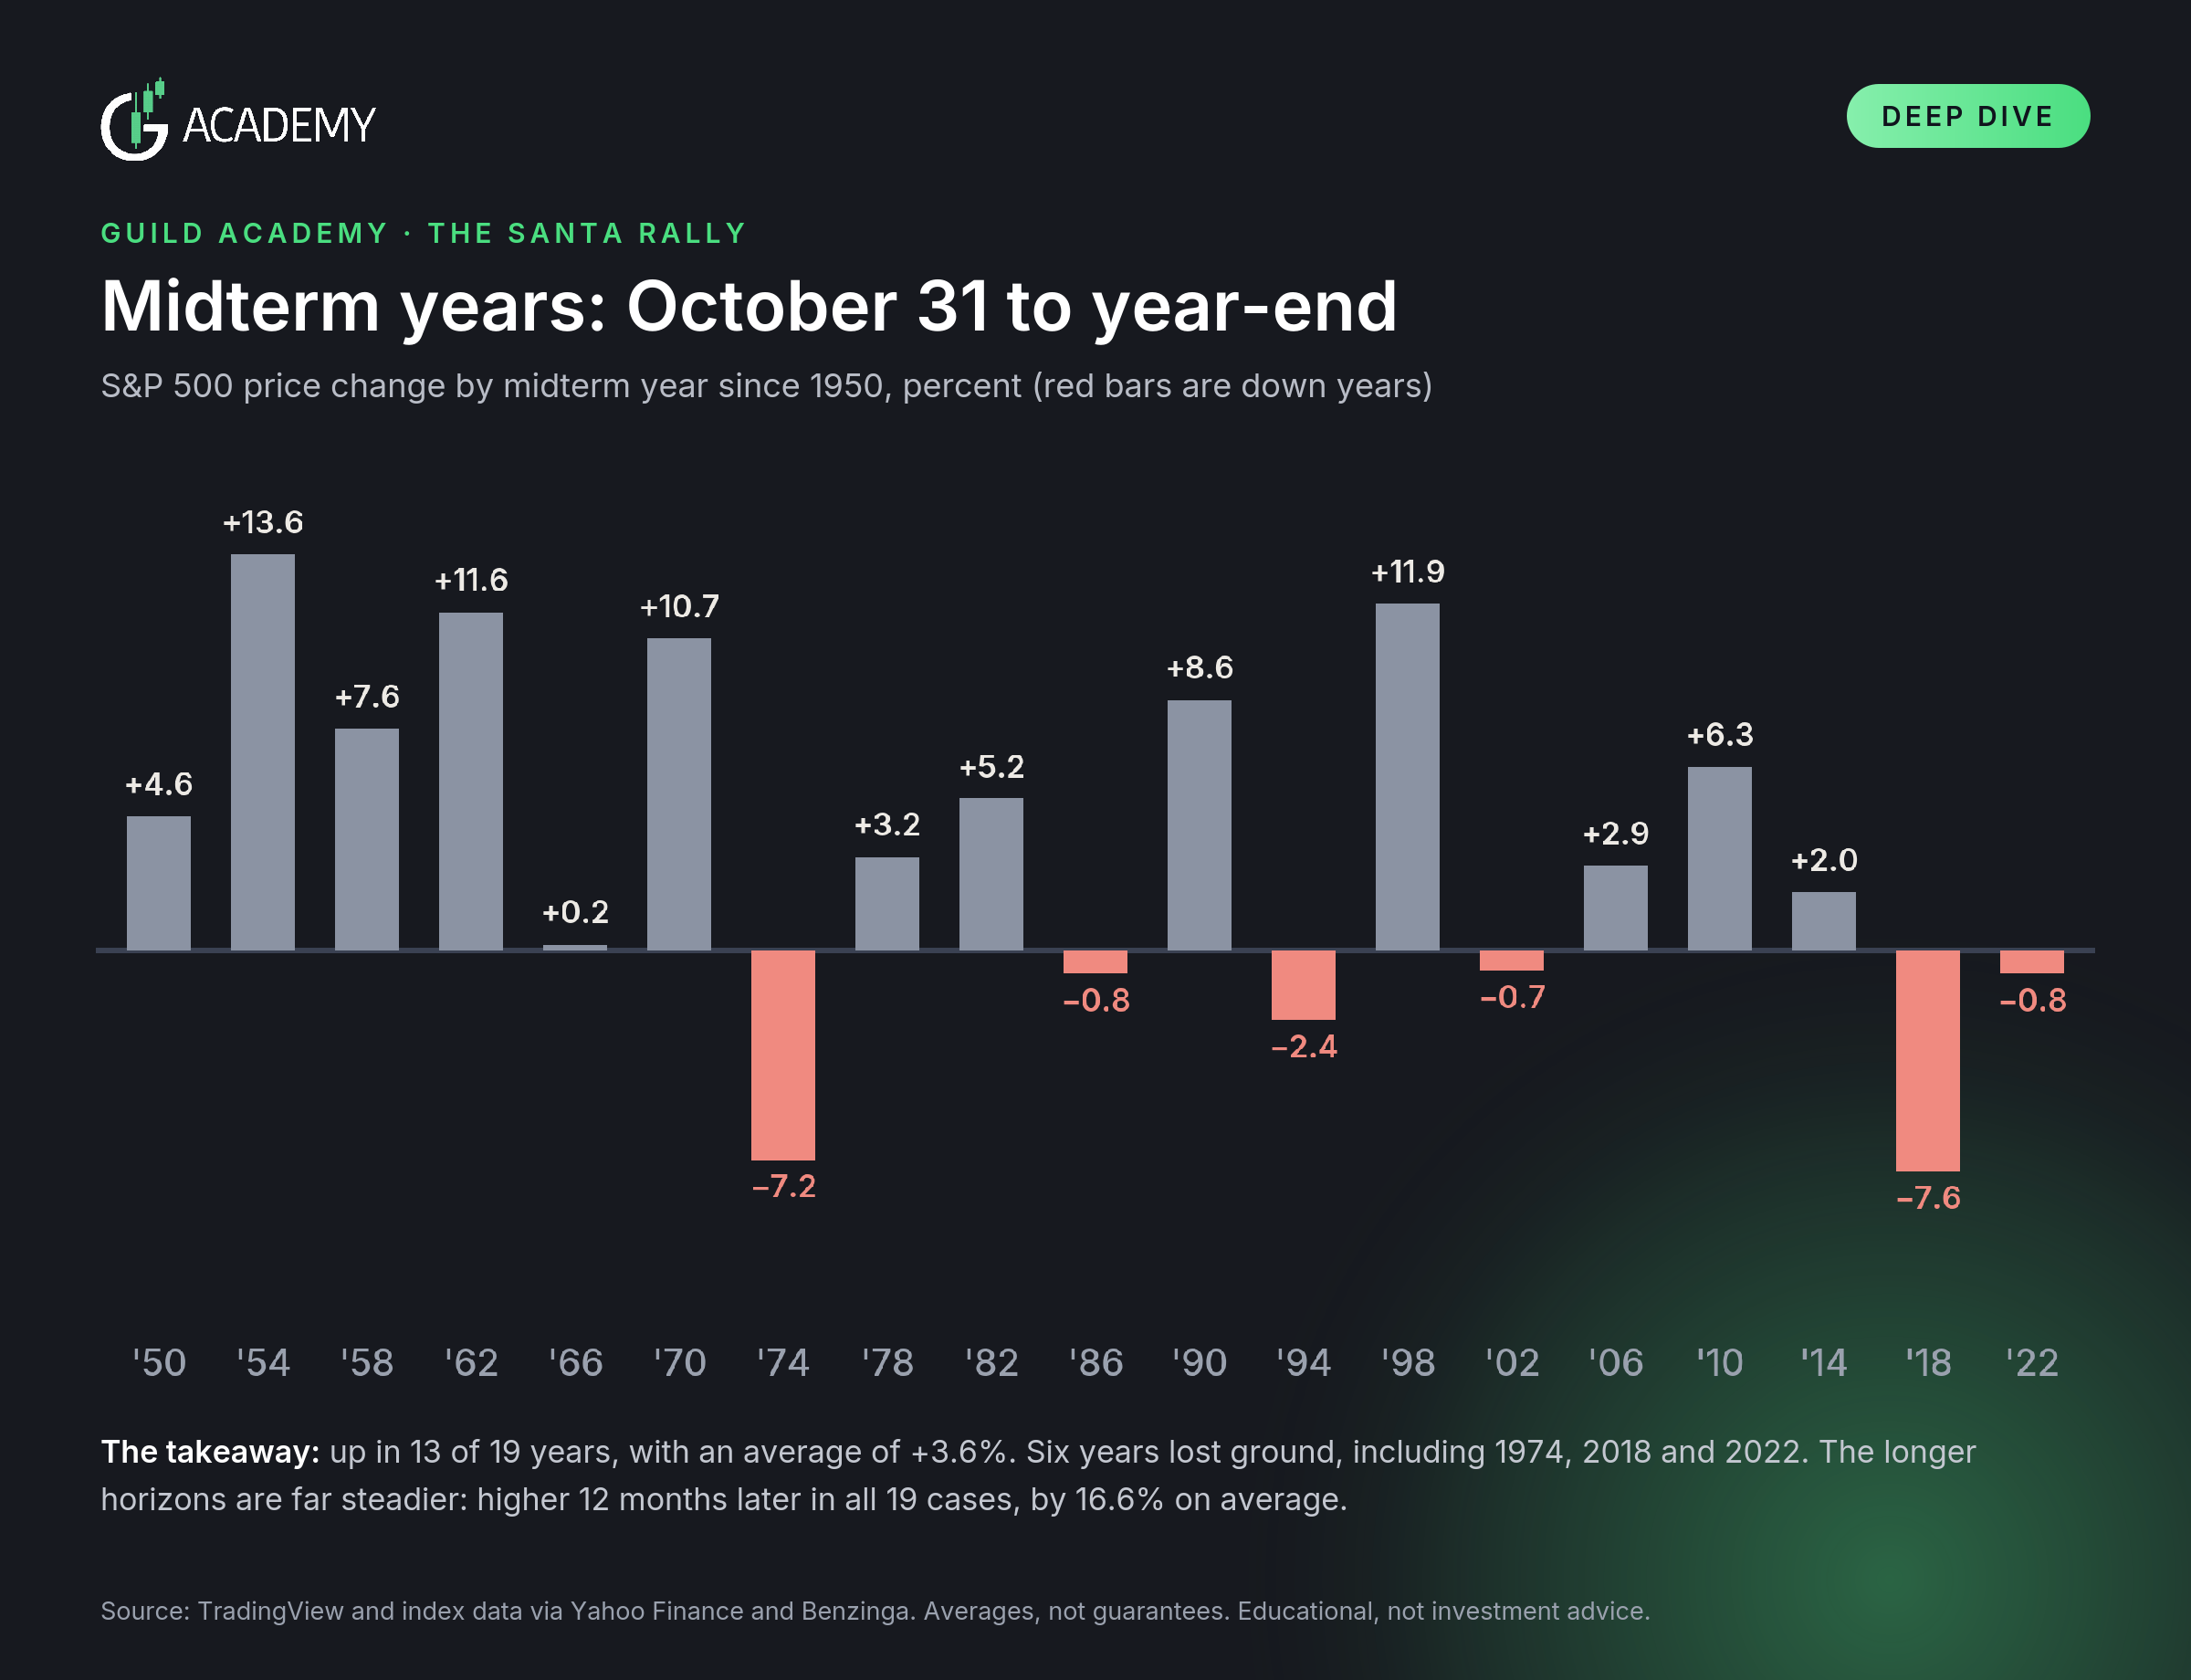
The longer horizons are far steadier, which is why the pattern is better described as a tilt than a timing signal. Three further details matter:
November. It has been the best month for the S&P 500 since 1950, averaging +1.86%. From November to April the index has averaged roughly +6.95%, against +2.08% from May to October.
A streak still alive. If the S&P 500 finishes April 30 above its October 30 close, the post-midterm run becomes 20 for 20 since 1950.
Election week. The eight sessions around Election Day have historically been the best stretch of a midterm year
What Is Different This Year
The textbook midterm year drops hard and bottoms in the autumn. This year has differed in three ways:
A shallow drawdown. The S&P 500's largest drop this year has been about 9%, against roughly 17.5% in a typical midterm year. Its low came in March, not in the autumn.
A strong year. The index is up about 11% to 12% for the year, when midterm years are typically flat by October and average +4.6% for the full year. It set its record on October 6.
A narrow engine. The seven biggest tech stocks make up more than 34% of the index. Their moves steer it, which is why the index can hide a lot of action underneath.
This week showed exactly that. On Thursday, the index fell while most of its stocks rose:
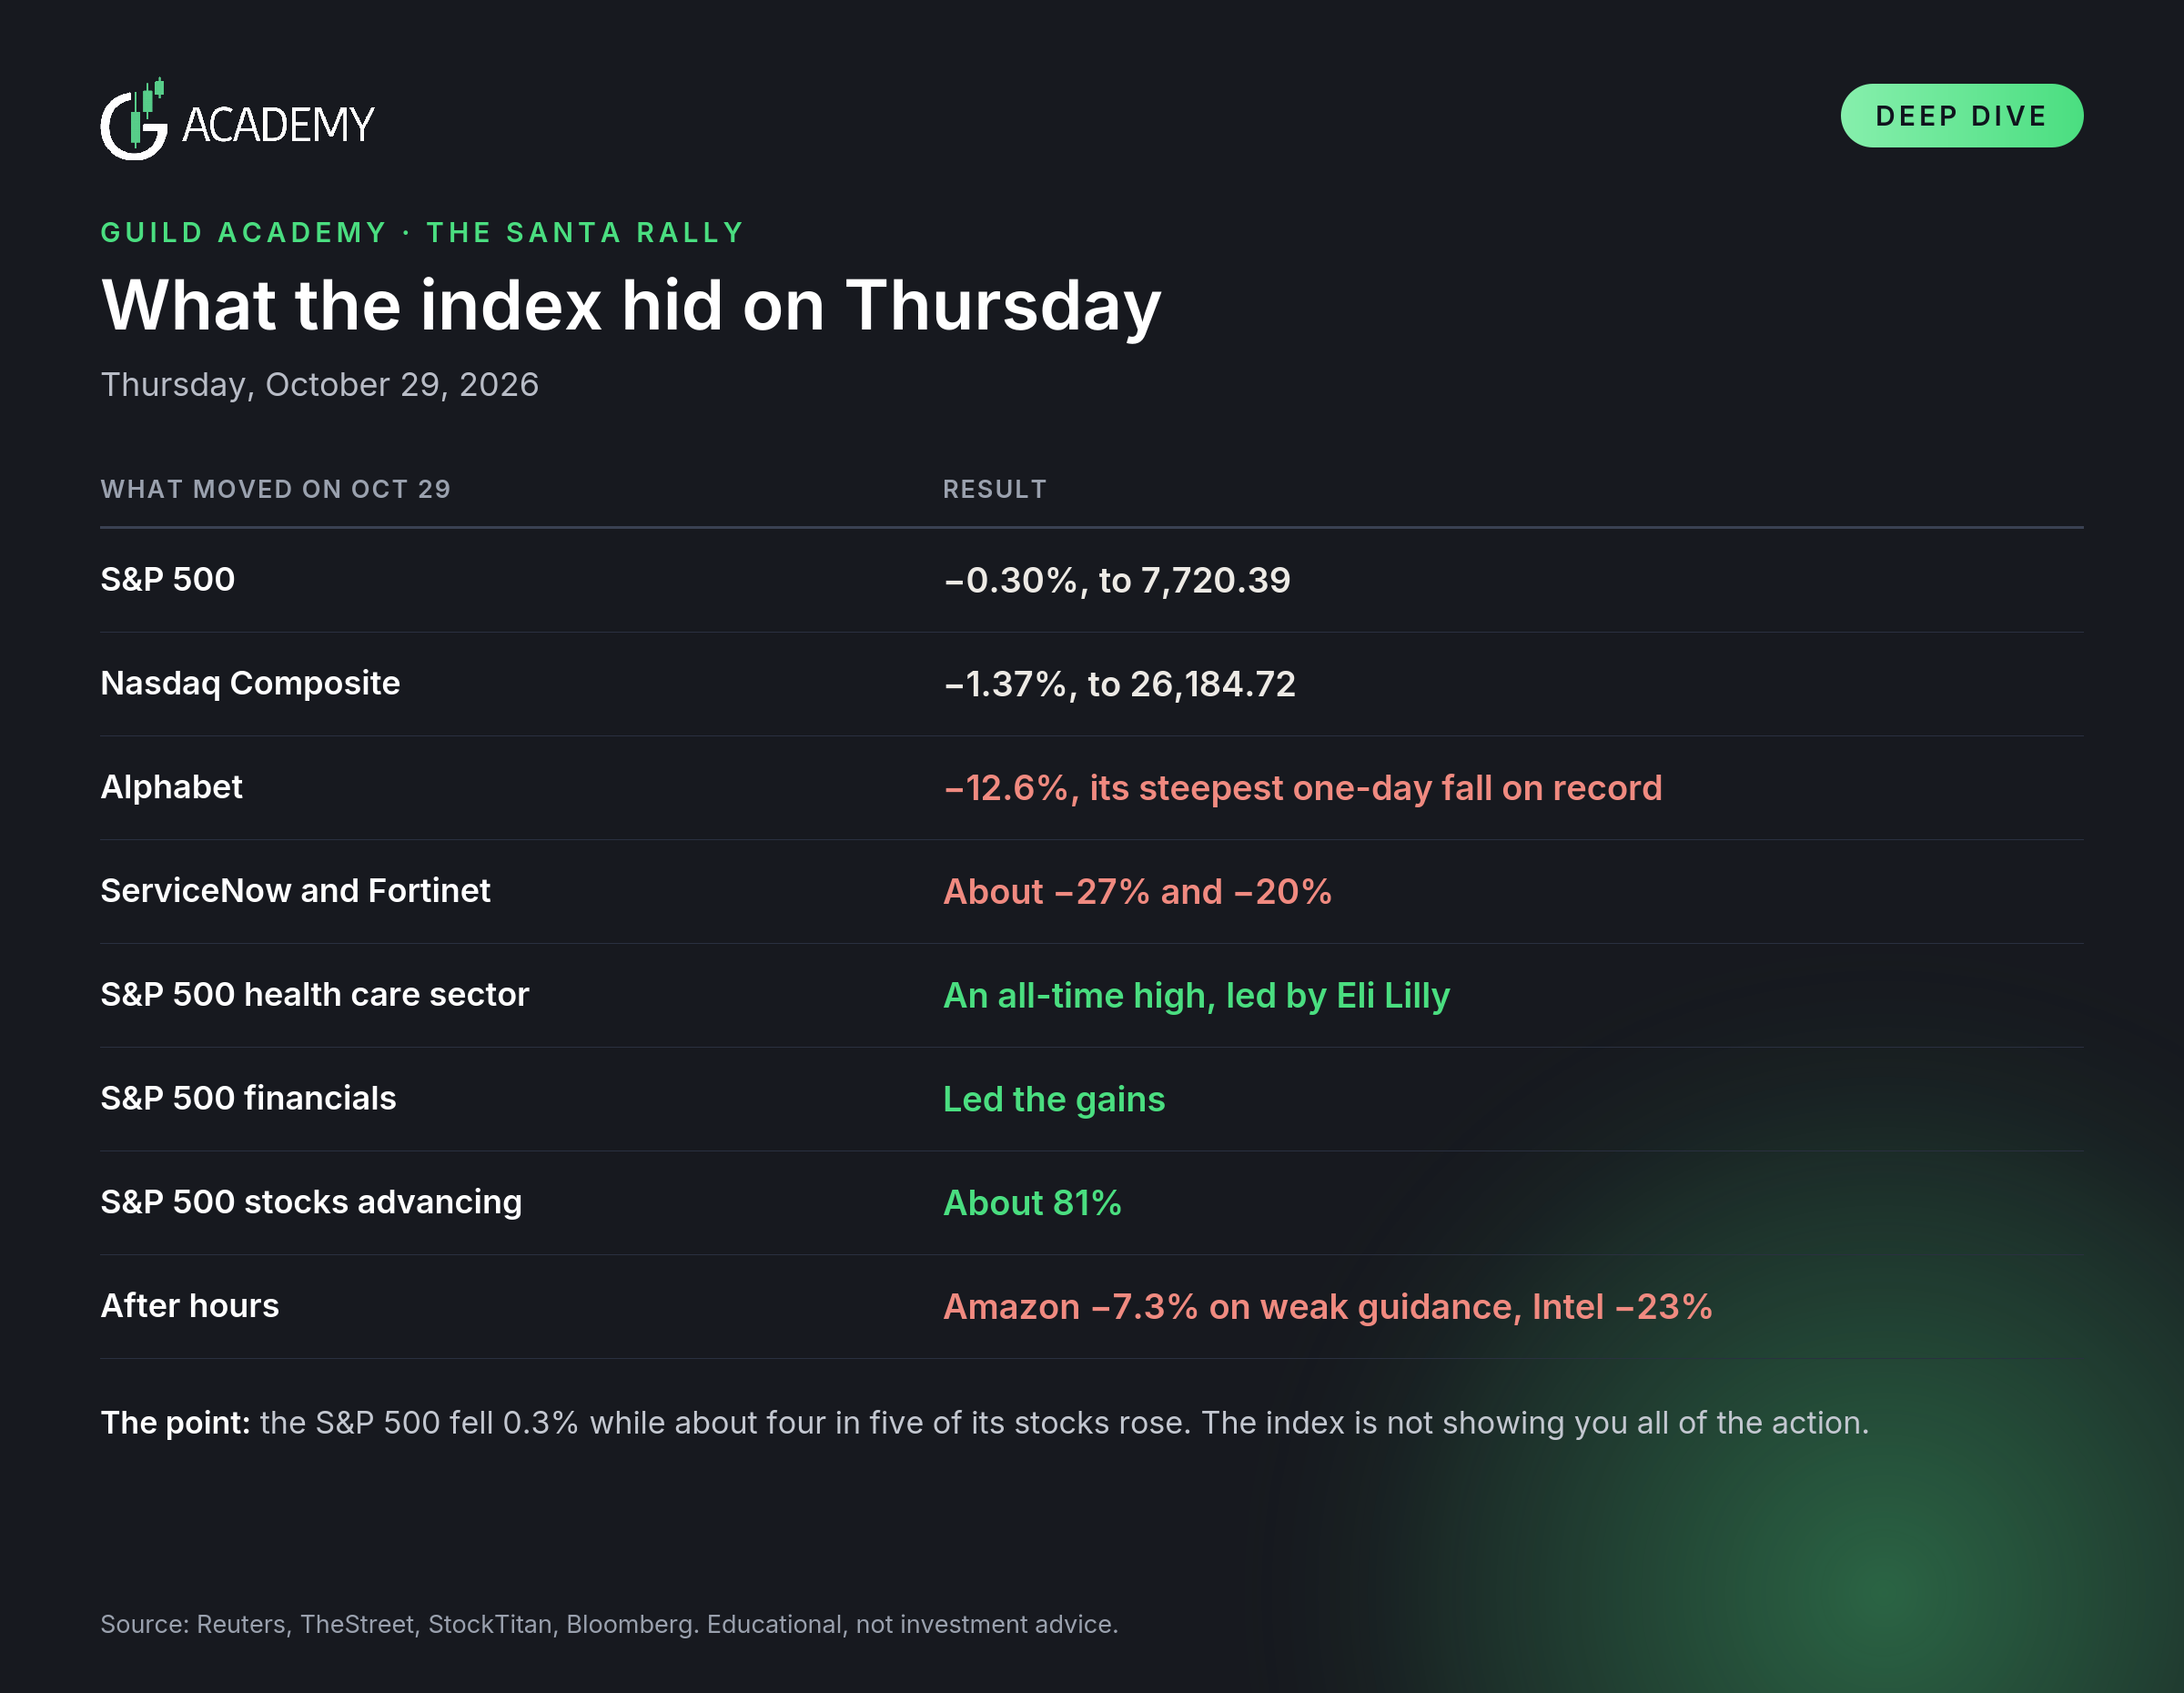
That is the point about the index not showing you all of the action. A 0.3% decline in the S&P 500 hid a heavy selloff in AI-linked names and a broad advance underneath. Money has been moving out of AI spenders and into health care, financials, staples, utilities and biotech, and the biotech ETF IBB was within about 2% of its high earlier this week. If a year-end rally comes, it may arrive in industries and quality laggards before it shows up in the index.
Four Ways the Next Two Months Could Play Out
The seasonal data supports a positive tilt from November through April. It says little about the path or about December. These are four plausible scenarios, and none is a forecast.
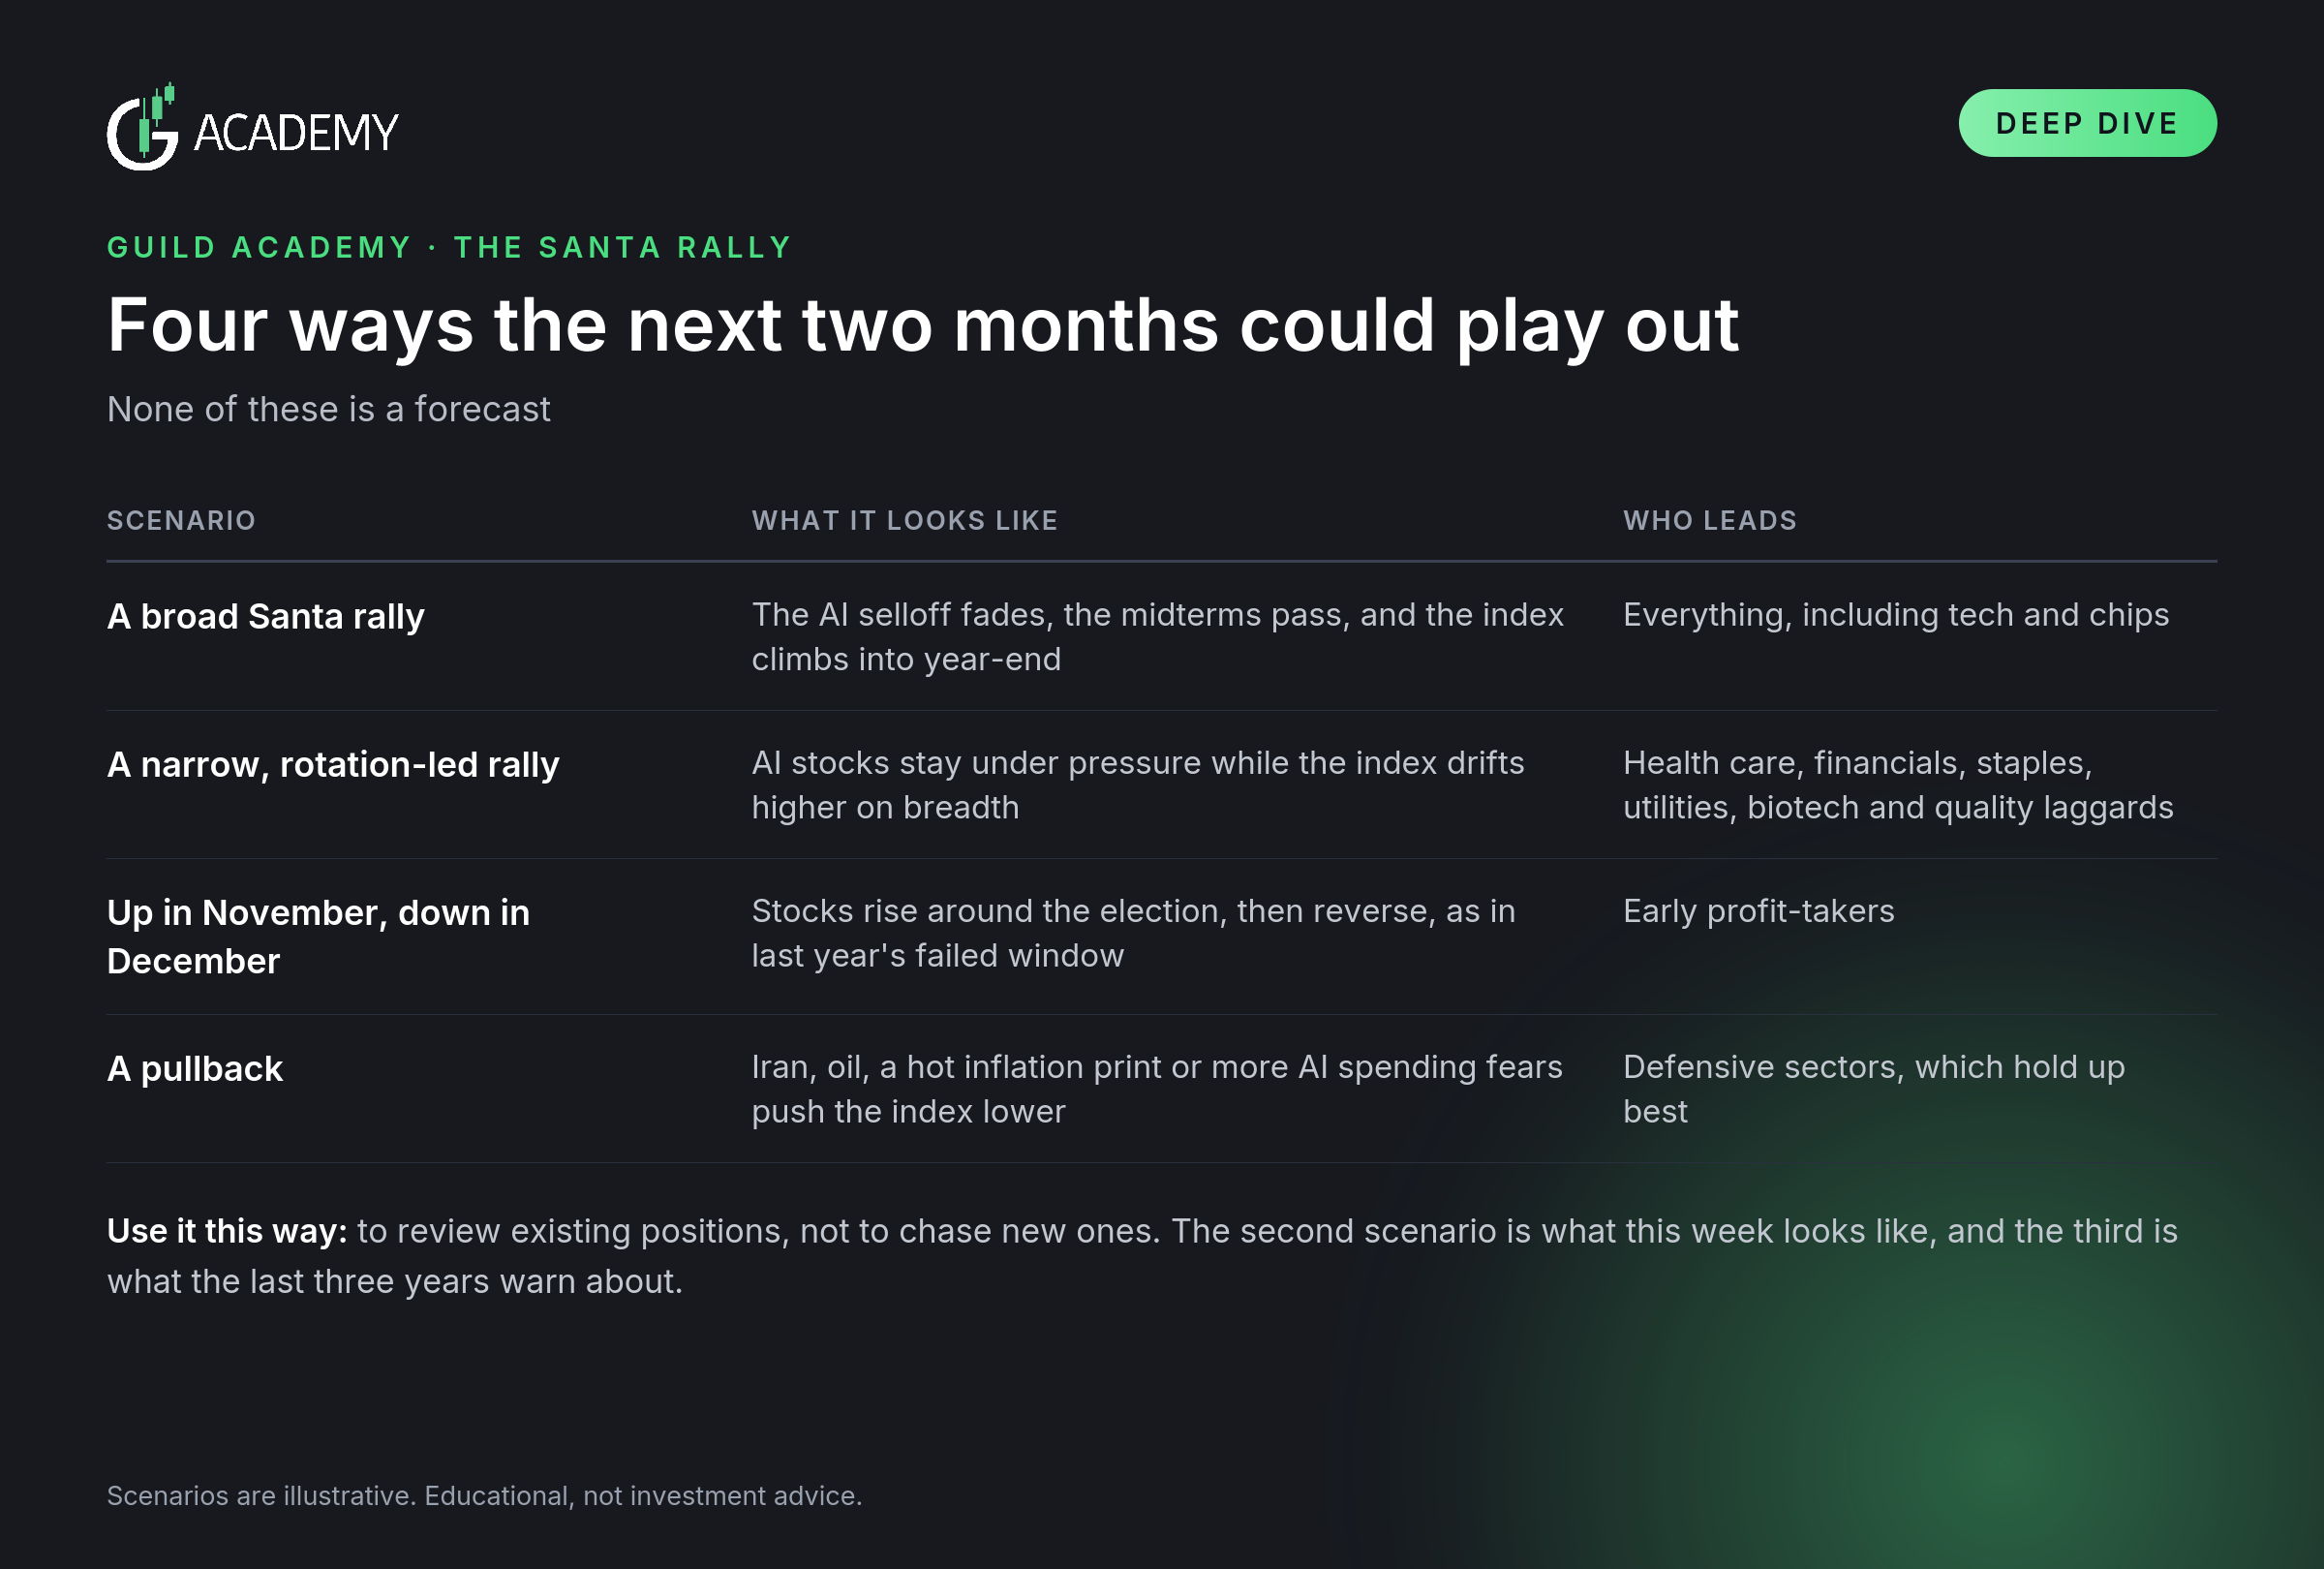
The second scenario is what this week's action looks like. The money is already rotating, and the indexes are not showing all of it. The third is the one the last three years warn about, since the Santa window has failed each time.
The practical use of this information is to review existing positions, not to chase new ones. If your positions lean on one of these scenarios, the data can help you decide what to add and what to trim.
What to watch:
The midterms on Tuesday, November 3. Whether the market follows the election-week pattern described above.
The AI trade. Amazon fell about 7% and Intel about 23% after hours on Thursday, and Nasdaq 100 futures were down about 1.9% overnight. Whether the selloff spreads or stabilizes will set the tone for the index.
The Fed on December 9. Hot PCE inflation of 3.6% and a 10-year yield near 5% keep a December hike in play, which is a headwind for a year-end rally.
Iran and oil. Any development in the conflict can move energy prices, inflation expectations and the whole market.
Rotation. Whether health care, financials, staples and biotech keep leading, or whether tech rebounds.
Risks:
Averages are not guarantees. The sample is 19 midterm cycles, and six of them lost ground between October and year-end.
A narrow engine. With seven stocks above a third of the index, a further AI selloff can drag the index down even while most stocks rise.
December. The Santa window has failed three years in a row, so a November gain is not a reason to assume December will follow.
Crowded rotation. Defensive sectors have already had a strong run, so they are not free of pullback risk.
None of this is a recommendation to buy or sell anything. It describes what history and this week's data suggest, so that existing plays can be added to or trimmed with context.