Deep Dive: Fear Is Right on Schedule in a Midterm October
Fear showed up on schedule. October of a midterm year is when volatility tends to arrive, and last week it did, with the S&P 500 down 1.95% to 7,659, its worst week since late June. The pattern is familiar, and so is the best response: stay positioned and stay patient.
What happened last week
The index is still up about 12% this year and roughly flat on the month, but several pressures hit at once:
Chips. The Philadelphia Semiconductor Index fell eight sessions in a row, its longest losing streak since October 2008, and is down 16% since October 6. All 30 members fell on Friday, and the group has lost more than $1 trillion in market value. Semiconductors are about a fifth of the S&P 500's value.
Neoclouds. CoreWeave, which carries roughly $50 billion of debt, fell 12% on Friday and about 25% over five days. The worry is the debt used to build AI data centers, and Palantir fell 7.2% on the same day.
Rates and oil. September CPI came in hotter than expected at 3.7%, with core at 2.6%. The 10-year yield touched 5.33% and oil moved back above $100.
France and Europe. The gap between French and German 10-year yields reached about 147 basis points in early October, the widest in more than a decade, and French yields approached 5%, the highest since 2002. The euro fell to a 17-month low against the dollar.
Why this is on schedule
Midterm years are the weakest of the four-year presidential cycle, and the uncertainty tends to build into the election. Options markets show it: implied volatility has historically climbed from about 13% early in a midterm year toward 20% as the vote approaches.
What follows has been the reliable part. BlackRock puts the average S&P 500 return in the six months after a midterm election at 14.1%, and RBC Wealth Management puts the 12-month average at 16.3%. One research note tracking the pattern since 1950 describes the 12 months after a midterm vote as positive in essentially every instance. Health care has been the standout in the back half of midterm years, finishing July through December higher every time on record.
That is the case for patience. The midterms are on November 3, and the argument is that the market will be higher by June 2027 than wherever it sits on election day. It is a strong historical pattern, not a guarantee, and it rests on a small sample of about 19 midterm cycles.
What the VIX move says
The VIX jumped 21.45% on Friday to 19.99 while the S&P 500 fell only 1.09%. It was the biggest one-day rise since June 5, and it came on a modest move in the index. That mismatch is the signal. The VIX is built from S&P 500 options prices, so a jump like that means demand for protection rose faster than the market fell. Investors are hedging, not just selling, and reports also pointed to rumors of distress at an unnamed hedge fund.
Keep the level in proportion. A VIX near 20 is close to its long-run average, so the speed is the story, not the altitude. History also leans toward a reset. Since 1990 the VIX has jumped 20% or more on a Friday 32 times, and it fell the next Monday 25 of those times. Stock futures were higher into Monday. Some traders are betting the other way by buying November VIX calls, so the hedging is not finished.
Where the money went
Last week was rotation, not liquidation. About two-thirds of S&P 500 stocks closed higher on the week even as the index fell, and technology was the only sector in the red for October.
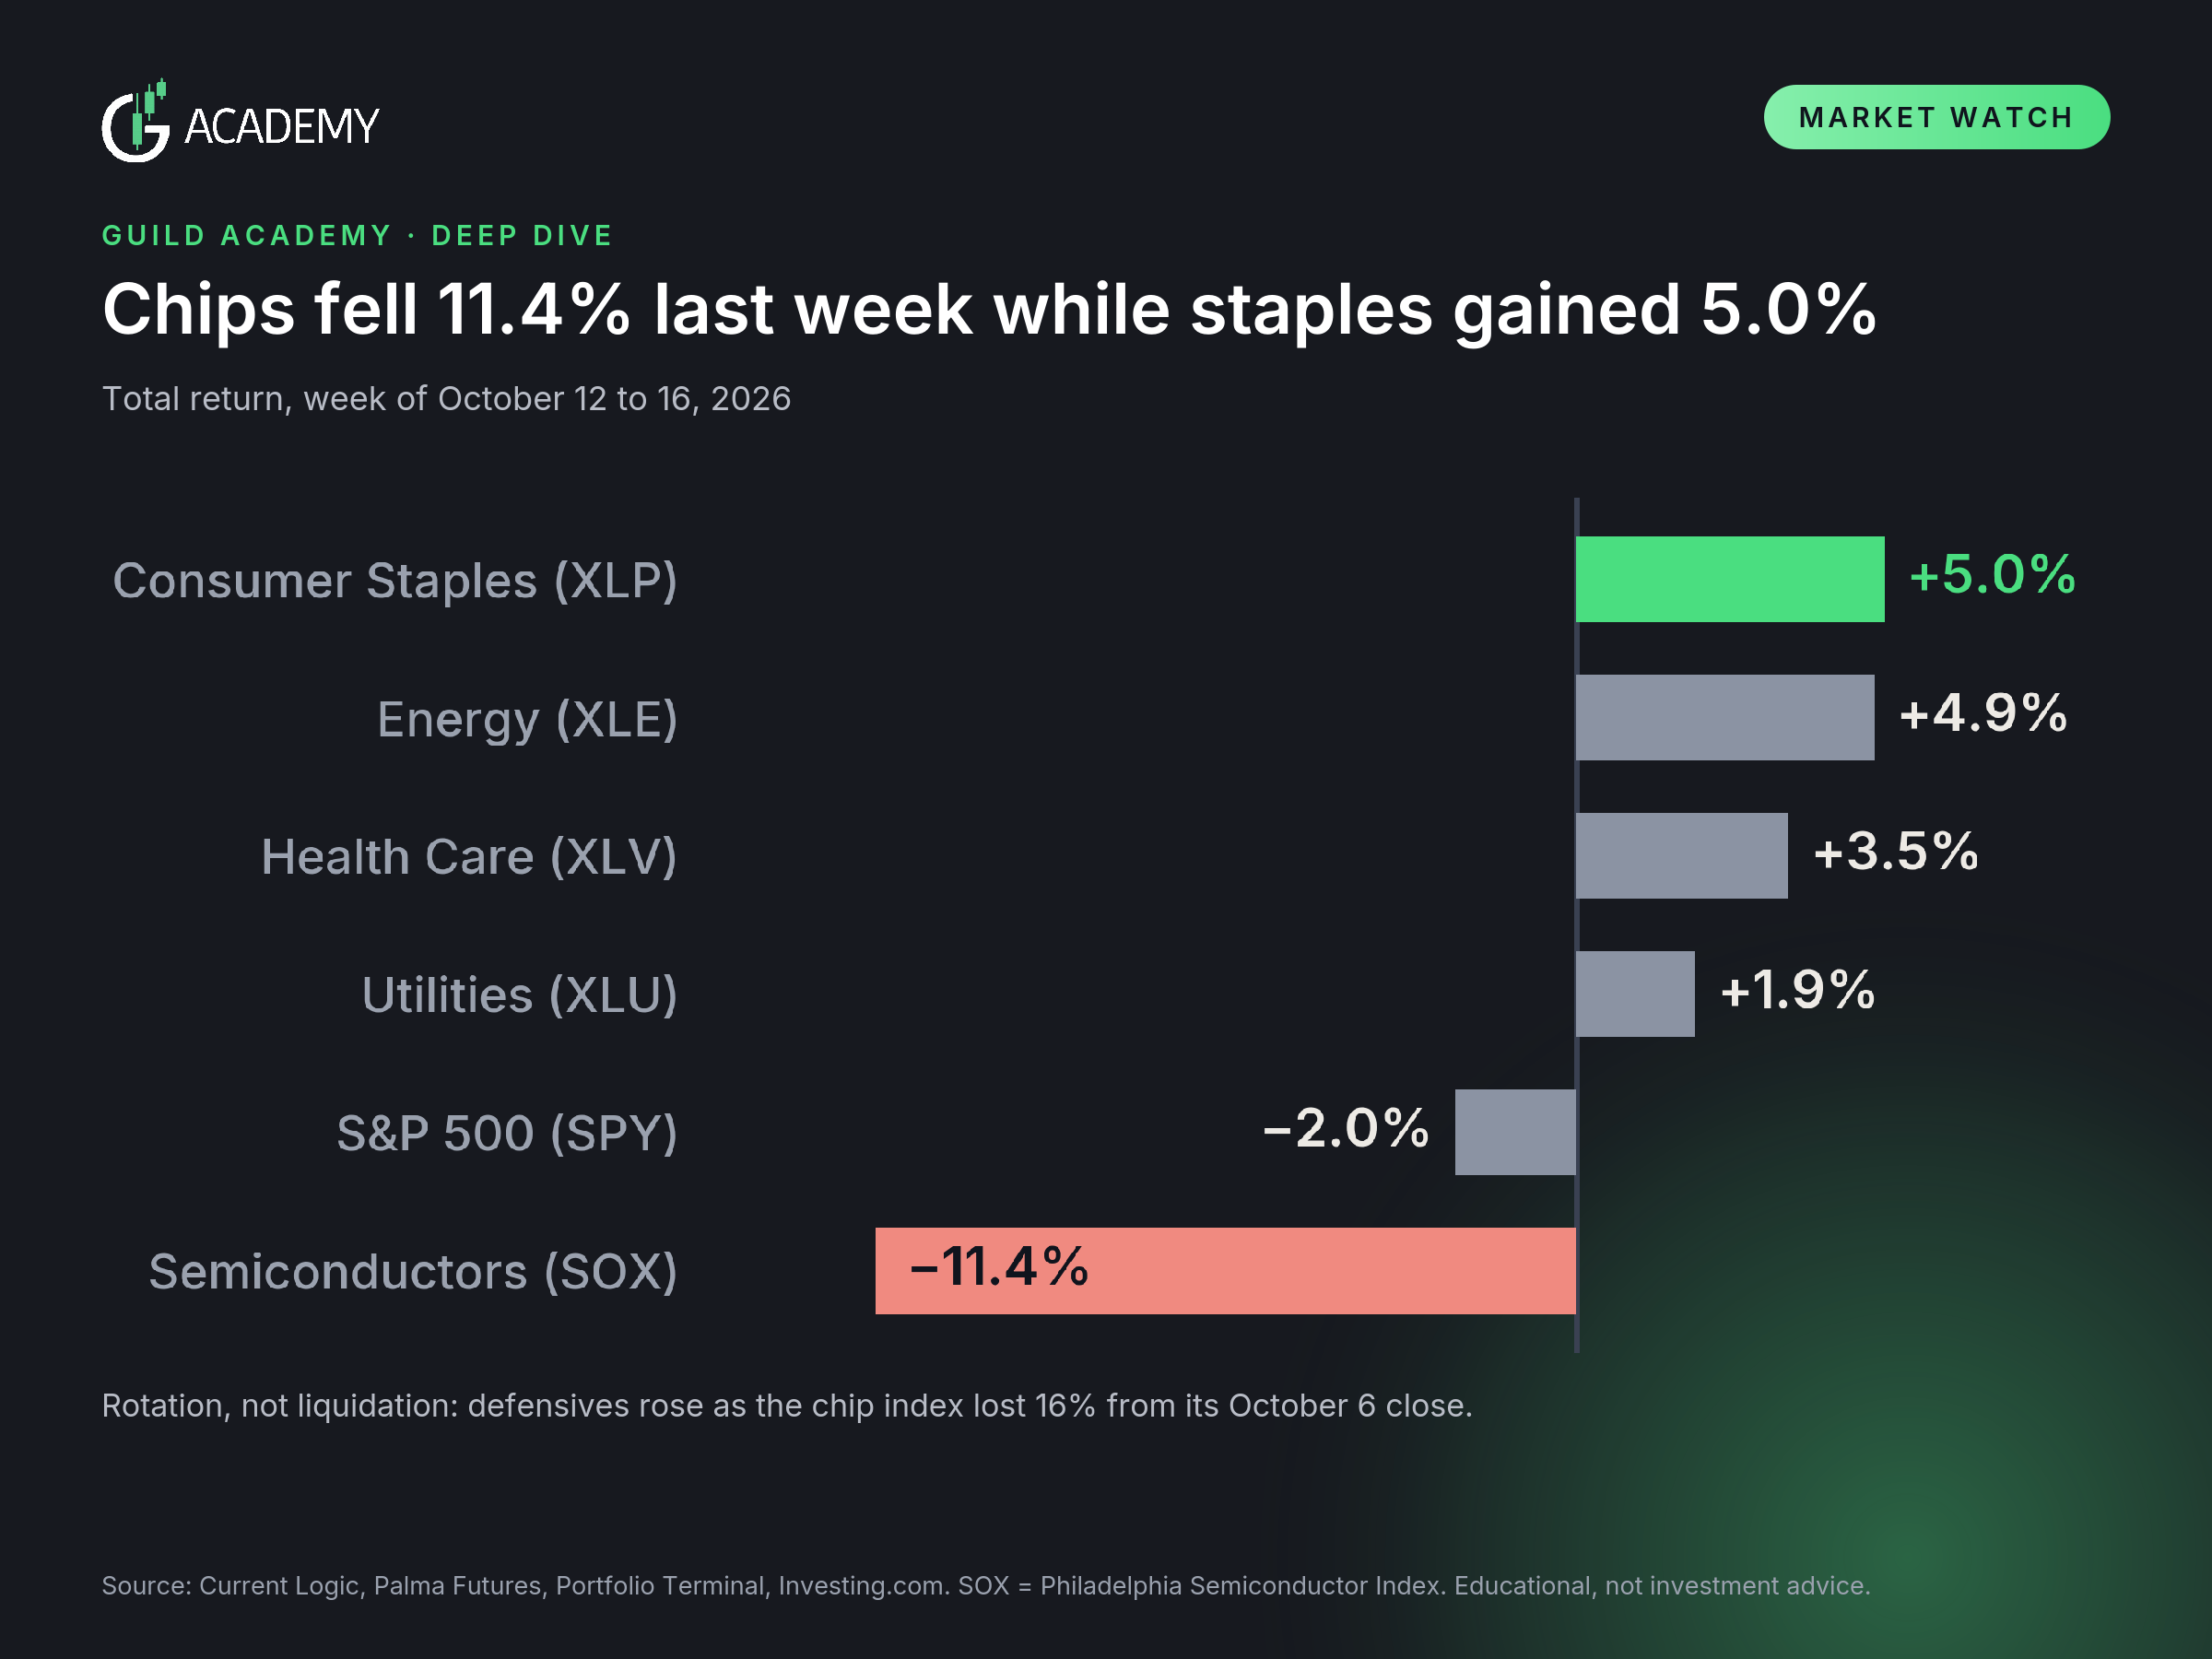
The defensive groups were not touched by the fear. Staples rose 5.0% on the week and Health Care 3.5%, and XLV made another all-time high. Utilities gained 1.9%. Since September 29, by my calculation XLP is up about 7%, XLU about 6% and XLV about 3.5%. Year to date, Health Care is up 14.2% and Staples 12.8%, while Utilities are still down 1.1%.
Two cautions. Staples are overbought, with an RSI near 72, so a pause is possible. And utilities have bounced hard but remain the weakest of the three.
The laggard idea: MKC and GIS
Staples as a group have rallied, but two of the biggest laggards in the sector are McCormick (MKC) and General Mills (GIS). The idea is that they follow the path Keurig Dr Pepper (KDP) took earlier this year: it lagged the rotation, then caught up as the rotation kept going.
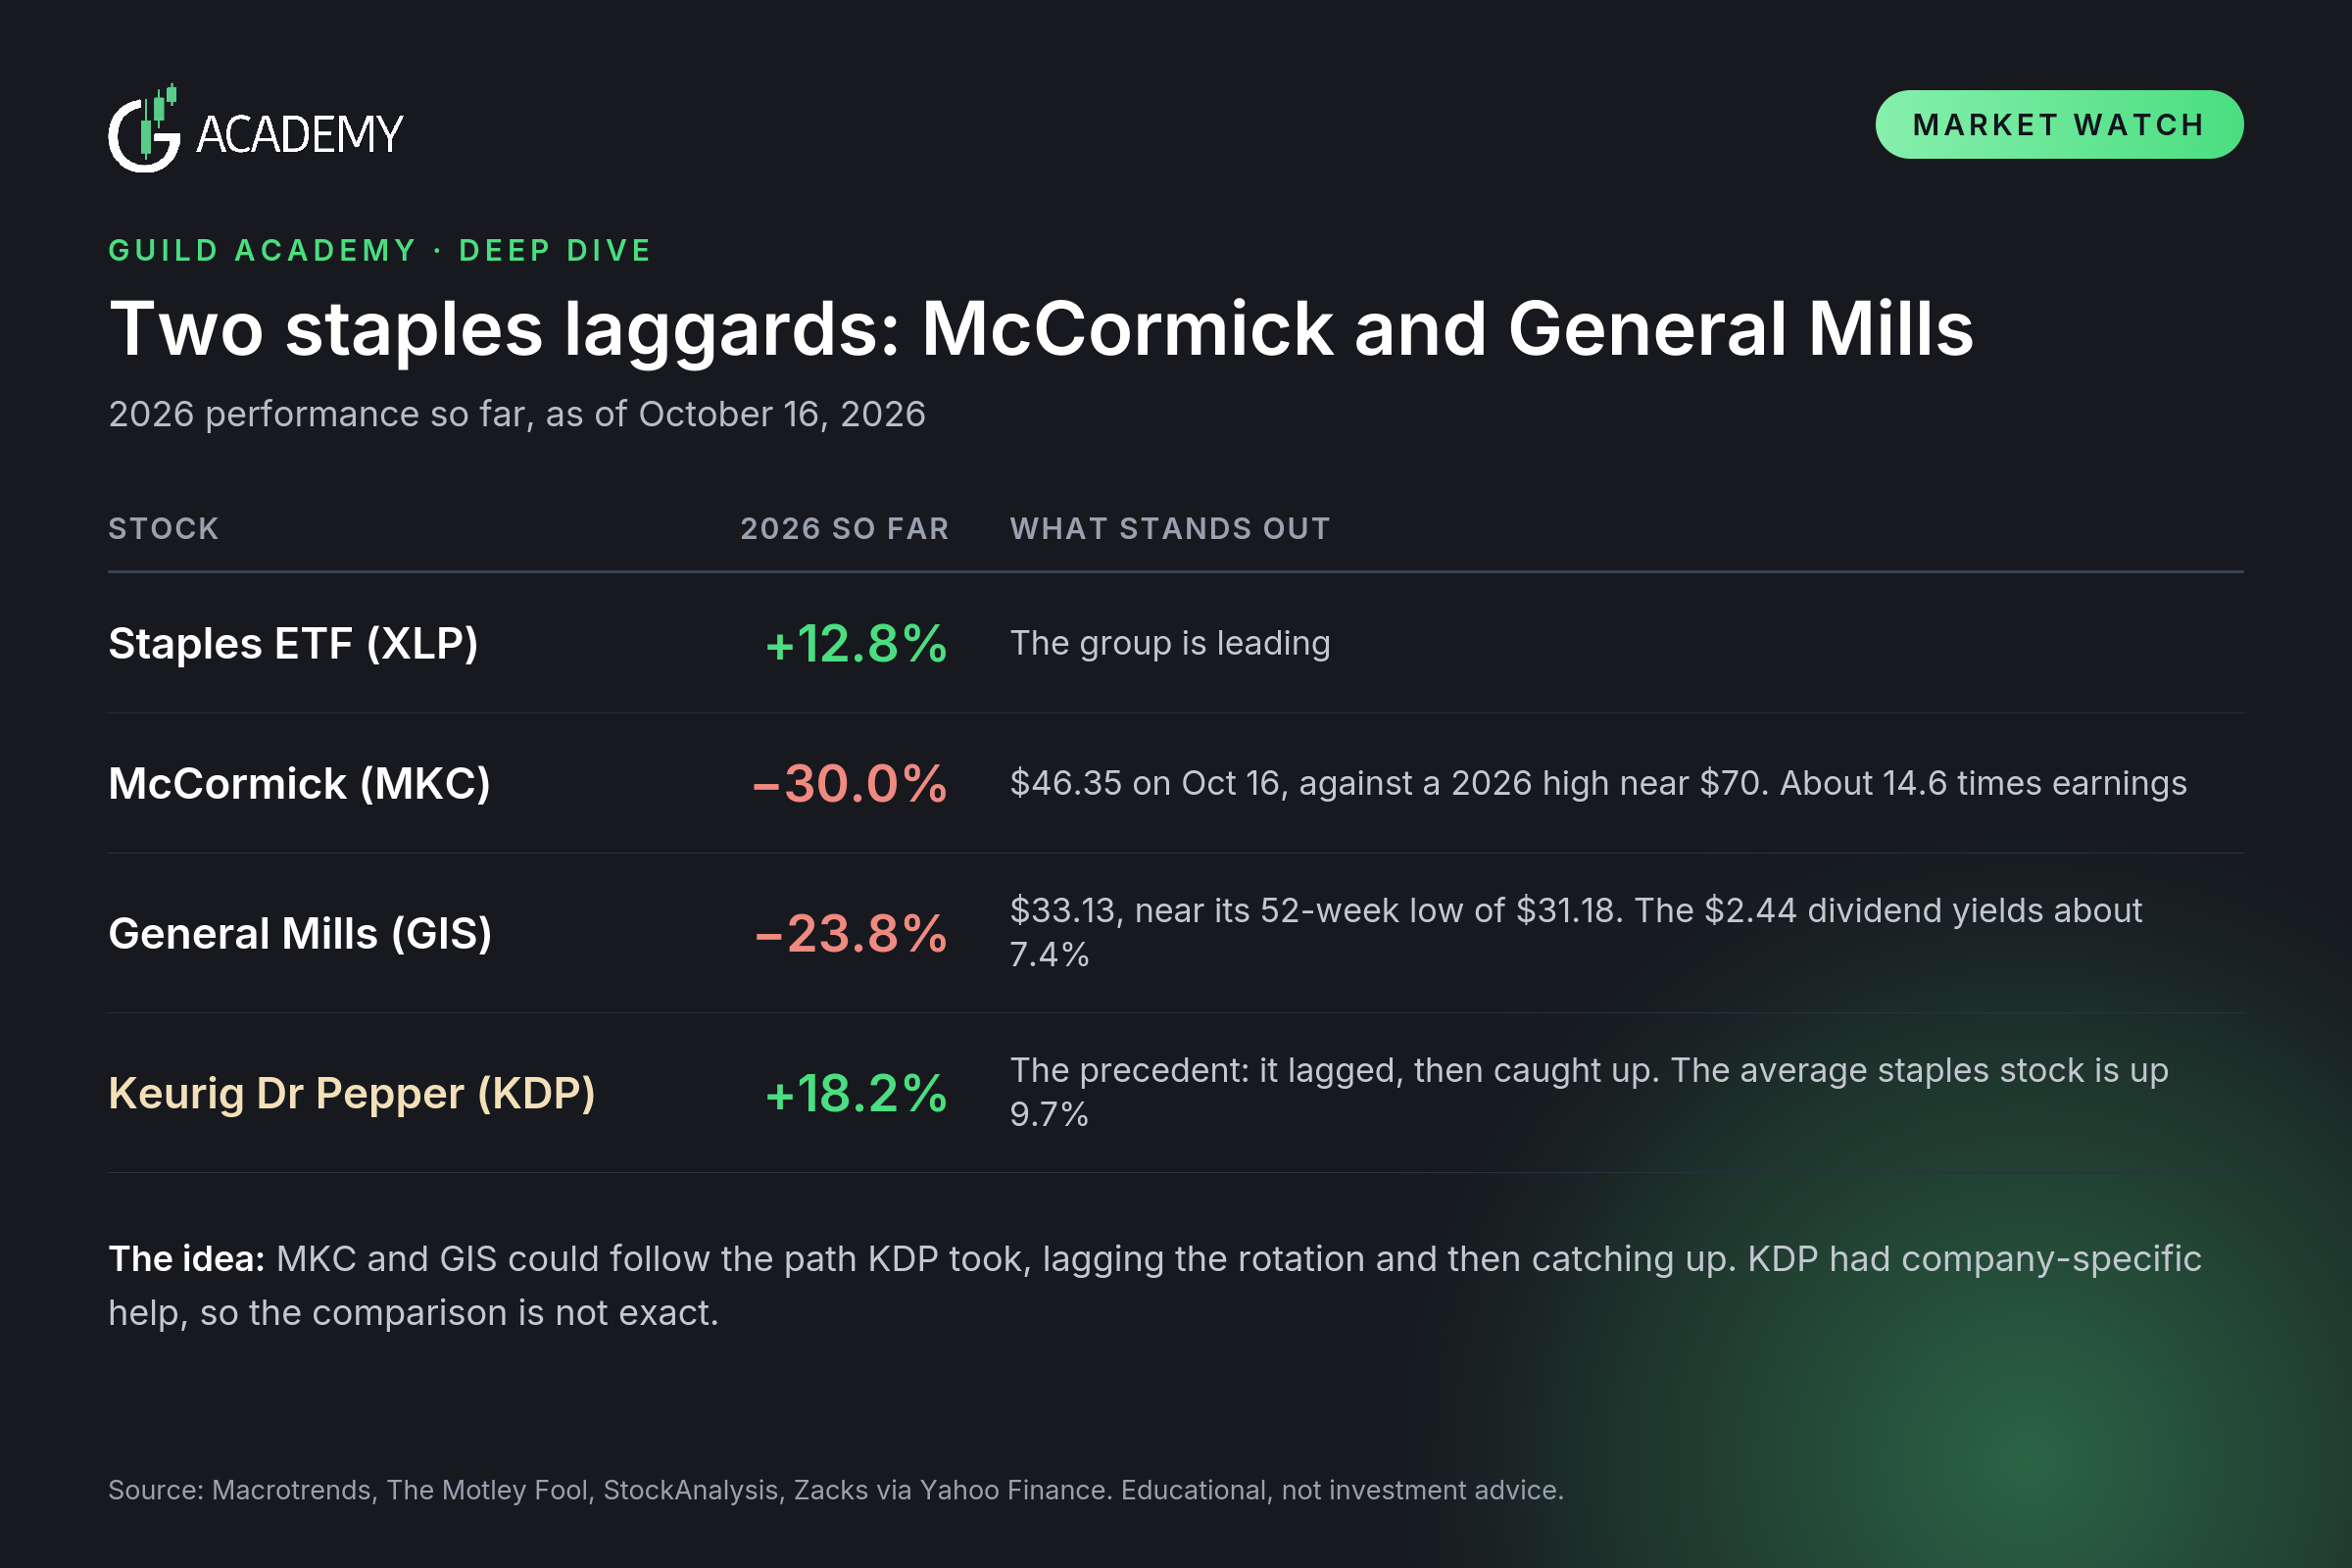
The KDP precedent fits the pattern. It fell about 29% from its October 2025 peak to near its 52-week low in the spring, weighed down by the debt from its JDE Peet's acquisition. It is now up 18.2% this year against 9.7% for the average staples stock. That is the catch-up the idea relies on.
Where the comparison breaks: KDP's recovery had company-specific help, including the completed acquisition and plans to separate into two companies. MKC and GIS have no obvious catalyst of their own. General Mills reported a continued decline in sales in September and cut its full-year sales outlook earlier this year, and a yield near 7% suggests the market doubts the dividend. Valuations are low, but cheap stocks can stay cheap if the rotation fades. The health care laggards are next.
Risks and what to watch
The plan is to ride the wave, not to ignore it. What could change the picture:
The chip streak. Eight straight losses is the longest since 2008. A ninth would tie the record of nine, set in 1996 and 2006, and a tenth would break it. The 2008 runs were followed by further weakness, though that was a credit crisis and this one is about AI spending, oil and rates.
The AI debt story. CoreWeave and other neoclouds are the weak link. Strong memory demand, with DDR5 prices up 79% this year, has not stopped the selling, so it is sentiment and financing driving this, not demand.
Rates. The 10-year touched 5.33% after a hot CPI, and the Fed meets on October 28. Higher yields hurt defensives too, especially utilities.
France. The budget vote is the next test. French yields have eased from their highs, and the spread was about 137 basis points on Friday, but strategists say a no-confidence vote or a downgrade could push it wider.
Crowding. Staples are overbought, so the defensive trade can pause even if the thesis is intact.
The longer view is patience. Even if volatility gets worse into the midterms, the historical pattern argues for being higher by June 2027 than wherever the market sits on election day. Something truly unexpected could break that, but until it arrives, positioning is the answer, not fear.